

Dolzarb patternlar

Прямоугольник
сформирован 31.03 в 19:02:59 (UTC+0)
сила сигнала 1 из 5
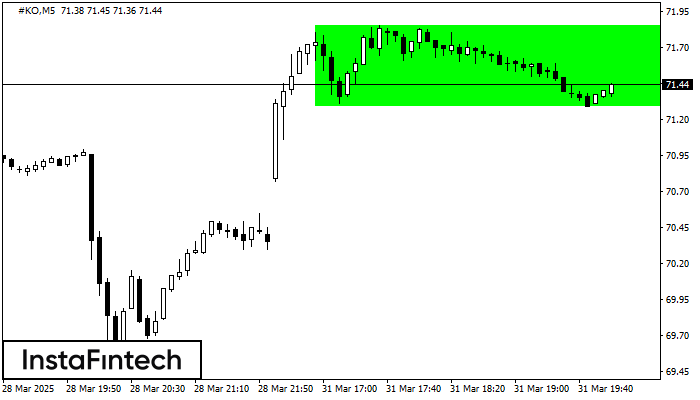
Сформирована фигура «Прямоугольник» на графике #KO M5. Тип фигуры: Продолжение тренда; Границы: Верхняя 71.85, Нижняя 71.29; Сигнал: позицию на покупку следует открывать выше верхней границы прямоугольника 71.85.
Таймфреймы М5 и М15 могут иметь больше ложных точек входа.
- Все
- Все
- Bearish Rectangle
- Bearish Symmetrical Triangle
- Bearish Symmetrical Triangle
- Bullish Rectangle
- Double Top
- Double Top
- Triple Bottom
- Triple Bottom
- Triple Top
- Triple Top
- Все
- Все
- Покупка
- Продажа
- Все
- 1
- 2
- 3
- 4
- 5
Head and Shoulders
сформирован 26.06 в 13:30:15 (UTC+0)
сила сигнала 3 из 5
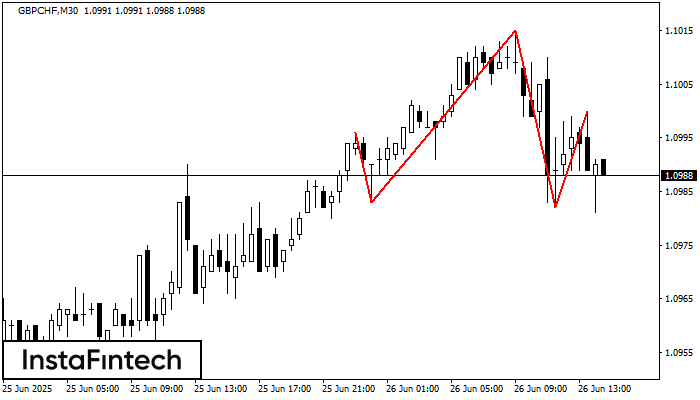
The GBPCHF M30 formed the Head and Shoulders pattern with the following features: The Head’s top is at 1.1015, the Neckline and the upward angle are at 1.0983/1.0982. The formation
Открыть график инструмента в новом окне
Double Top
сформирован 26.06 в 13:30:04 (UTC+0)
сила сигнала 3 из 5
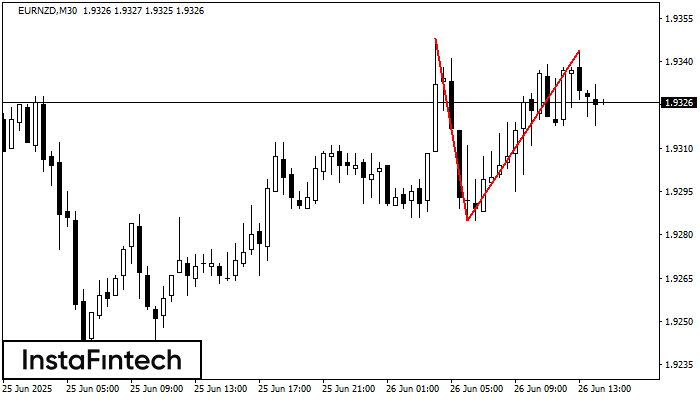
On the chart of EURNZD M30 the Double Top reversal pattern has been formed. Characteristics: the upper boundary 1.9344; the lower boundary 1.9285; the width of the pattern 59 points
Открыть график инструмента в новом окне
Head and Shoulders
сформирован 26.06 в 13:25:10 (UTC+0)
сила сигнала 1 из 5
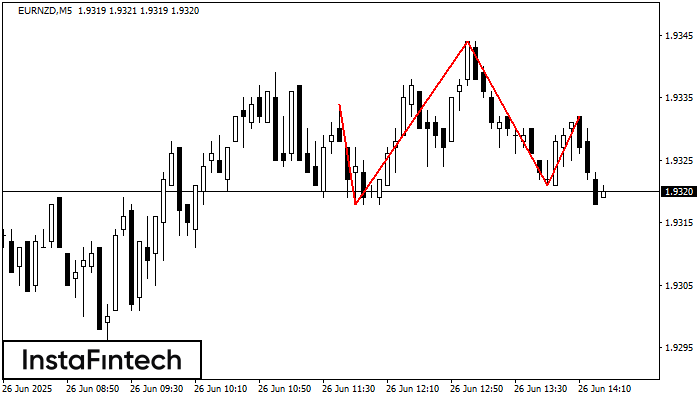
The technical pattern called Head and Shoulders has appeared on the chart of EURNZD M5. There are weighty reasons to suggest that the price will surpass the Neckline 1.9318/1.9321 after
The M5 and M15 time frames may have more false entry points.
Открыть график инструмента в новом окне


