

Dolzarb patternlar

Двойная вершина
сформирован 31.03 в 16:55:27 (UTC+0)
сила сигнала 1 из 5
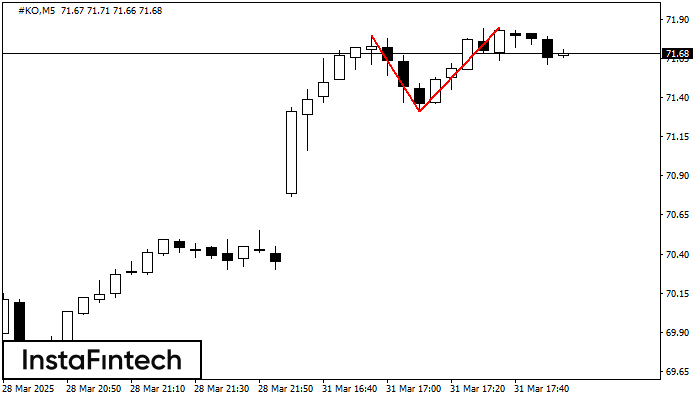
По #KO на M5 сформировалась разворотная фигура «Двойная вершина». Характеристика: Верхняя граница 71.80; Нижняя граница 71.31; Ширина фигуры 54 пунктов. Позицию на продажу возможно открыть ниже нижней границы 71.31, с перспективой хода к уровню 71.16.
Таймфреймы М5 и М15 могут иметь больше ложных точек входа.
- Все
- Все
- Bearish Rectangle
- Bearish Symmetrical Triangle
- Bearish Symmetrical Triangle
- Bullish Rectangle
- Double Top
- Double Top
- Triple Bottom
- Triple Bottom
- Triple Top
- Triple Top
- Все
- Все
- Покупка
- Продажа
- Все
- 1
- 2
- 3
- 4
- 5
Triple Bottom
was formed on 17.06 at 22:00:38 (UTC+0)
signal strength 1 of 5
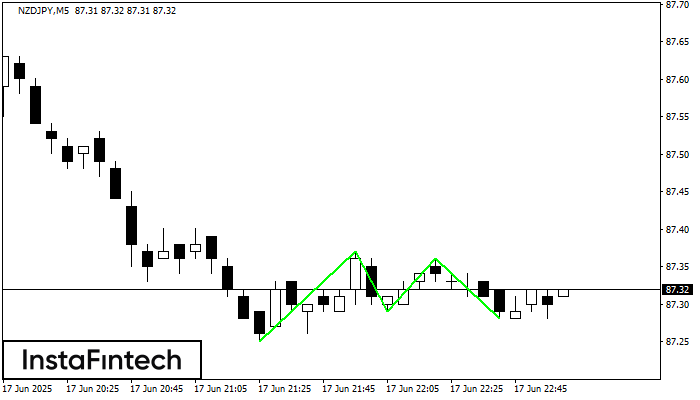
The Triple Bottom pattern has formed on the chart of NZDJPY M5. Features of the pattern: The lower line of the pattern has coordinates 87.37 with the upper limit 87.37/87.36
The M5 and M15 time frames may have more false entry points.
Open chart in a new window
Double Bottom
was formed on 17.06 at 21:30:44 (UTC+0)
signal strength 1 of 5
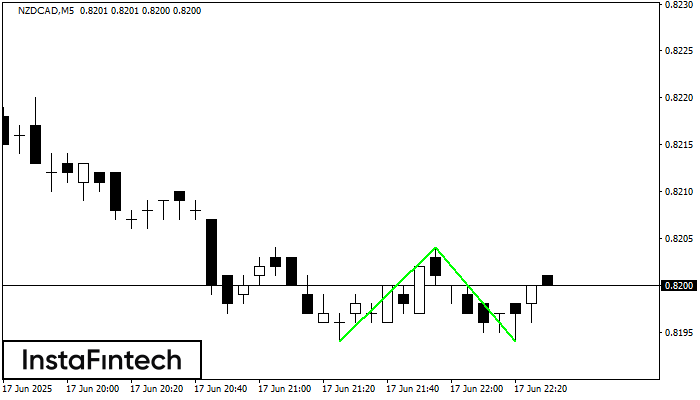
The Double Bottom pattern has been formed on NZDCAD M5. This formation signals a reversal of the trend from downwards to upwards. The signal is that a buy trade should
The M5 and M15 time frames may have more false entry points.
Open chart in a new window
Double Bottom
was formed on 17.06 at 21:30:23 (UTC+0)
signal strength 1 of 5
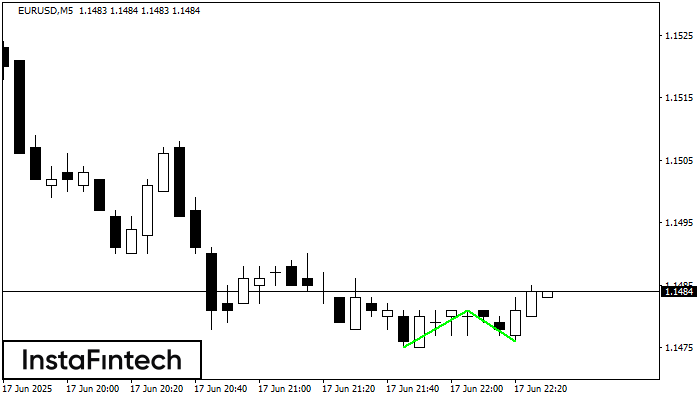
The Double Bottom pattern has been formed on EURUSD M5. Characteristics: the support level 1.1475; the resistance level 1.1481; the width of the pattern 6 points. If the resistance level
The M5 and M15 time frames may have more false entry points.
Open chart in a new window


