

Dolzarb patternlar

Медвежий симметричный треугольник
сформирован 31.03 в 14:11:15 (UTC+0)
сила сигнала 1 из 5
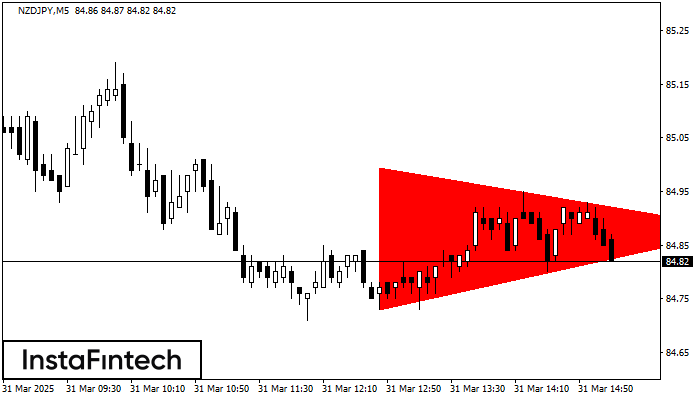
На графике NZDJPY на M5 сформировалась фигура «Медвежий симметричный треугольник». Торговые рекомендации: Пробой нижней границы 84.73 с большой долей вероятности приведет к продолжению нисходящего тренда.
Таймфреймы М5 и М15 могут иметь больше ложных точек входа.
Shuningdek ko'ring
- Все
- Все
- Bearish Rectangle
- Bearish Symmetrical Triangle
- Bearish Symmetrical Triangle
- Bullish Rectangle
- Double Top
- Double Top
- Triple Bottom
- Triple Bottom
- Triple Top
- Triple Top
- Все
- Все
- Покупка
- Продажа
- Все
- 1
- 2
- 3
- 4
- 5
Bullish Symmetrical Triangle
сформирован 20.06 в 08:55:18 (UTC+0)
сила сигнала 1 из 5
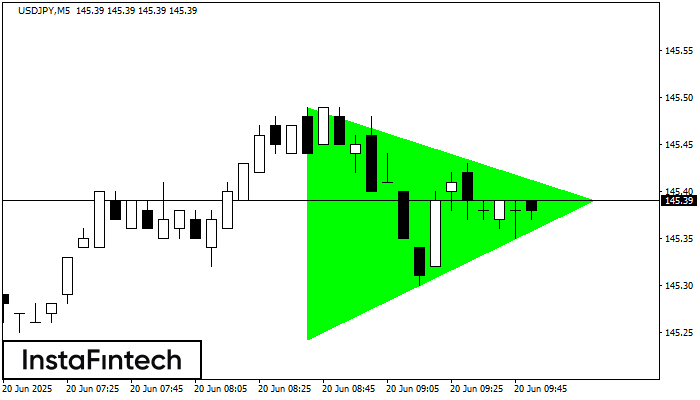
According to the chart of M5, USDJPY formed the Bullish Symmetrical Triangle pattern. The lower border of the pattern touches the coordinates 145.24/145.39 whereas the upper border goes across 145.49/145.39
The M5 and M15 time frames may have more false entry points.
Открыть график инструмента в новом окне
Triple Top
сформирован 20.06 в 08:25:40 (UTC+0)
сила сигнала 1 из 5
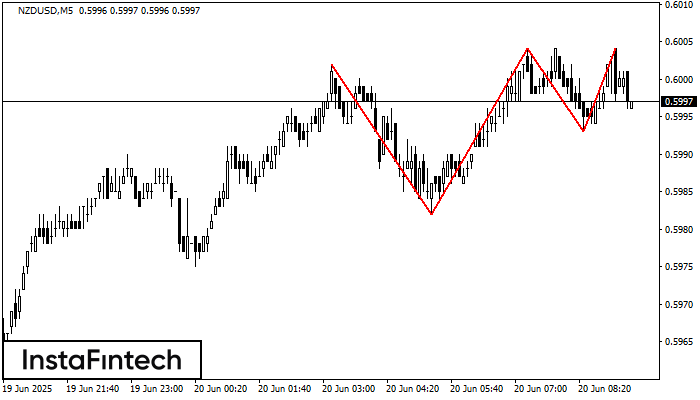
On the chart of the NZDUSD M5 trading instrument, the Triple Top pattern that signals a trend change has formed. It is possible that after formation of the third peak
The M5 and M15 time frames may have more false entry points.
Открыть график инструмента в новом окне
Triple Bottom
сформирован 20.06 в 07:30:07 (UTC+0)
сила сигнала 3 из 5
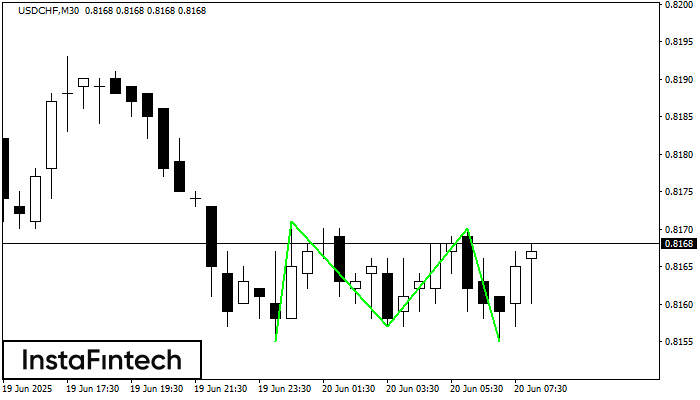
The Triple Bottom pattern has been formed on USDCHF M30. It has the following characteristics: resistance level 0.8171/0.8170; support level 0.8155/0.8155; the width is 16 points. In the event
Открыть график инструмента в новом окне


