

Dolzarb patternlar

Двойное дно
сформирован 30.03 в 23:00:32 (UTC+0)
сила сигнала 2 из 5
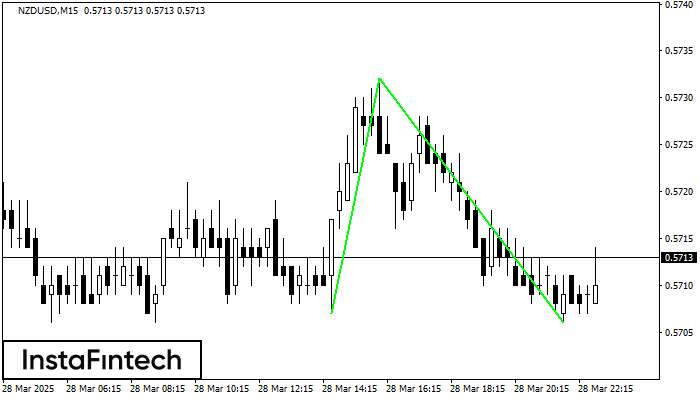
Сформирована фигура «Двойное дно» на графике NZDUSD M15. Верхняя граница 0.5732; Нижняя граница 0.5706; Ширина фигуры 25 пунктов. В случае пробоя верхней границы 0.5732 можно будет прогнозировать изменение тенденции, где ширина фигуры и будет являться расстоянием предположительного Тейк Профита.
Таймфреймы М5 и М15 могут иметь больше ложных точек входа.
- Все
- Все
- Bearish Rectangle
- Bearish Symmetrical Triangle
- Bearish Symmetrical Triangle
- Bullish Rectangle
- Double Top
- Double Top
- Triple Bottom
- Triple Bottom
- Triple Top
- Triple Top
- Все
- Все
- Покупка
- Продажа
- Все
- 1
- 2
- 3
- 4
- 5
Double Top
сформирован 27.06 в 18:40:07 (UTC+0)
сила сигнала 1 из 5
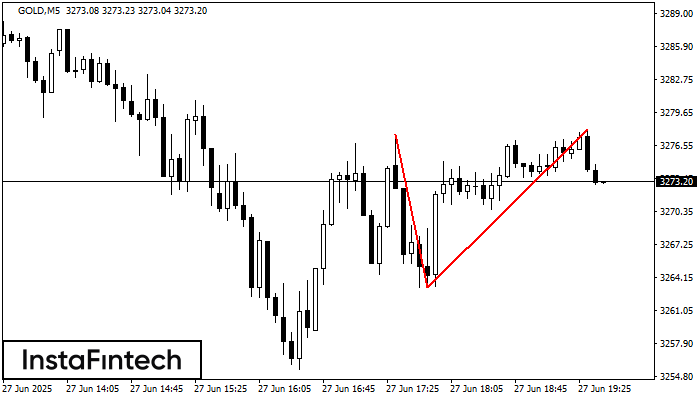
The Double Top pattern has been formed on GOLD M5. It signals that the trend has been changed from upwards to downwards. Probably, if the base of the pattern 3263.19
The M5 and M15 time frames may have more false entry points.
Открыть график инструмента в новом окне
Triple Top
сформирован 27.06 в 18:30:29 (UTC+0)
сила сигнала 1 из 5

The Triple Top pattern has formed on the chart of the #NTDOY M5. Features of the pattern: borders have an ascending angle; the lower line of the pattern
The M5 and M15 time frames may have more false entry points.
Открыть график инструмента в новом окне
Triple Top
сформирован 27.06 в 18:30:26 (UTC+0)
сила сигнала 1 из 5
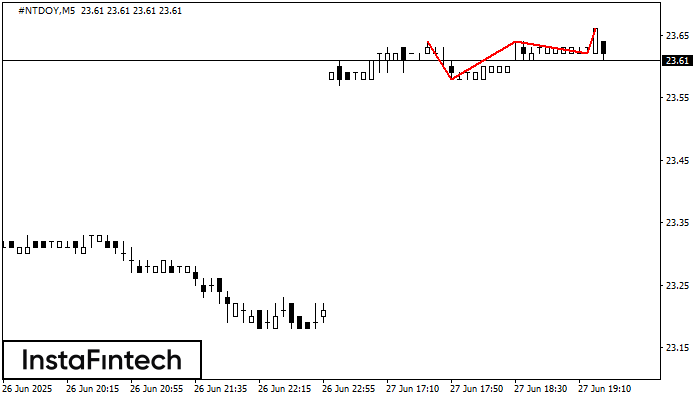
The Triple Top pattern has formed on the chart of the #NTDOY M5 trading instrument. It is a reversal pattern featuring the following characteristics: resistance level -2, support level -4
The M5 and M15 time frames may have more false entry points.
Открыть график инструмента в новом окне


