

Dolzarb patternlar

Двойное дно
сформирован 28.03 в 09:30:34 (UTC+0)
сила сигнала 3 из 5
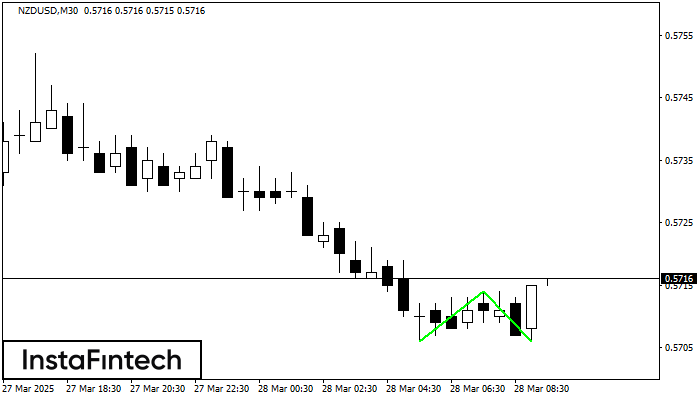
Сформирована фигура «Двойное дно» на графике NZDUSD M30. Данное формирование сигнализирует об изменении тенденции с нисходящего на восходящее движение. Сигнал: Торговую позицию на покупку следует открывать после пробоя верхней границы фигуры 0.5714, где перспектива будущего хода будет являться шириной текущей фигуры - 8 пунктов.
Shuningdek ko'ring
- Все
- Все
- Bearish Rectangle
- Bearish Symmetrical Triangle
- Bearish Symmetrical Triangle
- Bullish Rectangle
- Double Top
- Double Top
- Triple Bottom
- Triple Bottom
- Triple Top
- Triple Top
- Все
- Все
- Покупка
- Продажа
- Все
- 1
- 2
- 3
- 4
- 5
Double Top
сформирован 19.06 в 14:25:35 (UTC+0)
сила сигнала 1 из 5
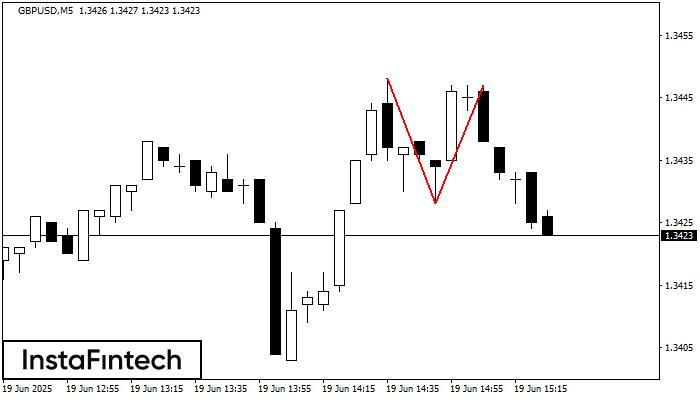
On the chart of GBPUSD M5 the Double Top reversal pattern has been formed. Characteristics: the upper boundary 1.3447; the lower boundary 1.3428; the width of the pattern 19 points
The M5 and M15 time frames may have more false entry points.
Открыть график инструмента в новом окне
Bullish Symmetrical Triangle
сформирован 19.06 в 13:25:32 (UTC+0)
сила сигнала 1 из 5
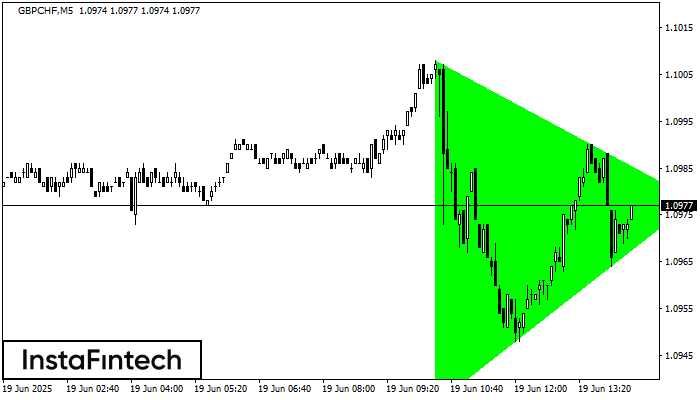
According to the chart of M5, GBPCHF formed the Bullish Symmetrical Triangle pattern. Description: This is the pattern of a trend continuation. 1.1008 and 1.0935 are the coordinates
The M5 and M15 time frames may have more false entry points.
Открыть график инструмента в новом окне
Double Top
сформирован 19.06 в 13:00:20 (UTC+0)
сила сигнала 2 из 5
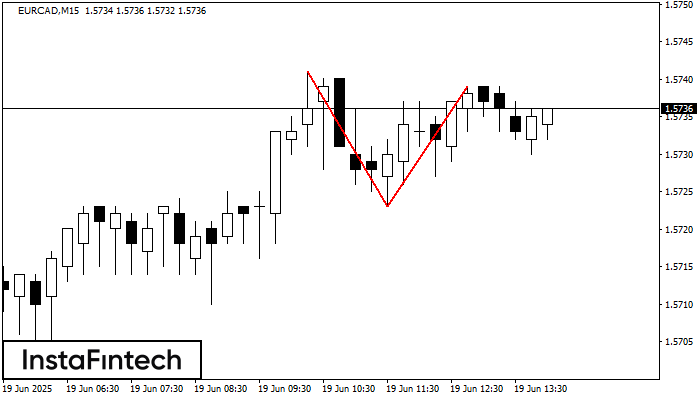
On the chart of EURCAD M15 the Double Top reversal pattern has been formed. Characteristics: the upper boundary 1.5739; the lower boundary 1.5723; the width of the pattern 16 points
The M5 and M15 time frames may have more false entry points.
Открыть график инструмента в новом окне


