

Dolzarb patternlar

Двойное дно
сформирован 28.03 в 09:30:15 (UTC+0)
сила сигнала 2 из 5
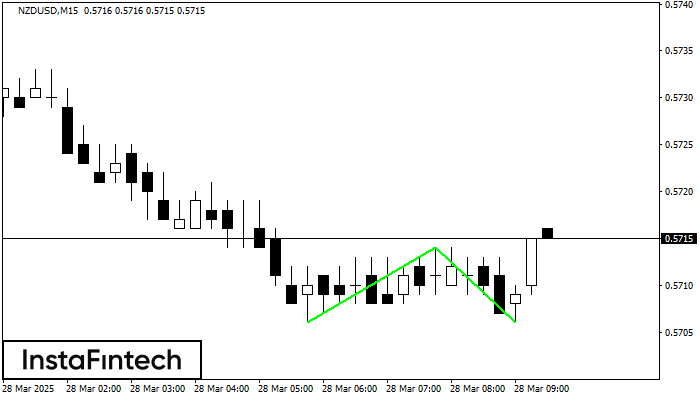
Сформирована фигура «Двойное дно» на графике NZDUSD M15. Данное формирование сигнализирует об изменении тенденции с нисходящего на восходящее движение. Сигнал: Торговую позицию на покупку следует открывать после пробоя верхней границы фигуры 0.5714, где перспектива будущего хода будет являться шириной текущей фигуры - 8 пунктов.
Таймфреймы М5 и М15 могут иметь больше ложных точек входа.
- Все
- Все
- Bearish Rectangle
- Bearish Symmetrical Triangle
- Bearish Symmetrical Triangle
- Bullish Rectangle
- Double Top
- Double Top
- Triple Bottom
- Triple Bottom
- Triple Top
- Triple Top
- Все
- Все
- Покупка
- Продажа
- Все
- 1
- 2
- 3
- 4
- 5
Bullish Symmetrical Triangle
сформирован 13.06 в 15:26:58 (UTC+0)
сила сигнала 3 из 5
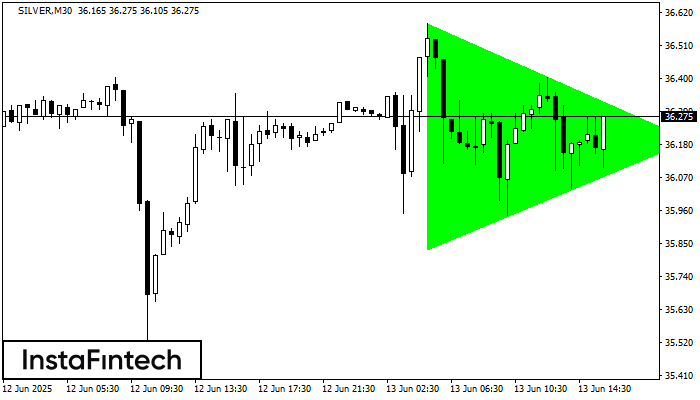
According to the chart of M30, SILVER formed the Bullish Symmetrical Triangle pattern. The lower border of the pattern touches the coordinates 35.83/36.20 whereas the upper border goes across 36.59/36.20
Открыть график инструмента в новом окне
Bullish Symmetrical Triangle
сформирован 13.06 в 15:15:27 (UTC+0)
сила сигнала 1 из 5
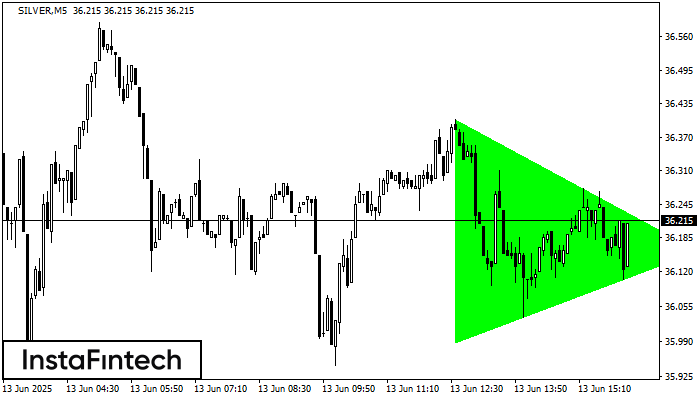
According to the chart of M5, SILVER formed the Bullish Symmetrical Triangle pattern. Description: This is the pattern of a trend continuation. 36.41 and 35.99 are the coordinates
The M5 and M15 time frames may have more false entry points.
Открыть график инструмента в новом окне
Triple Top
сформирован 13.06 в 14:15:20 (UTC+0)
сила сигнала 2 из 5
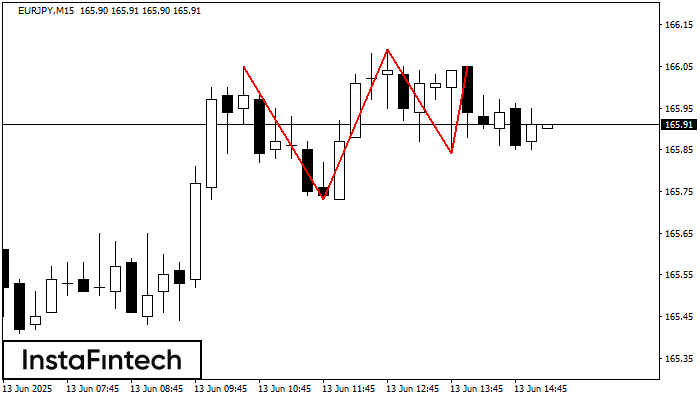
On the chart of the EURJPY M15 trading instrument, the Triple Top pattern that signals a trend change has formed. It is possible that after formation of the third peak
The M5 and M15 time frames may have more false entry points.
Открыть график инструмента в новом окне


