

Dolzarb patternlar

Двойное дно
сформирован 28.03 в 05:30:51 (UTC+0)
сила сигнала 1 из 5
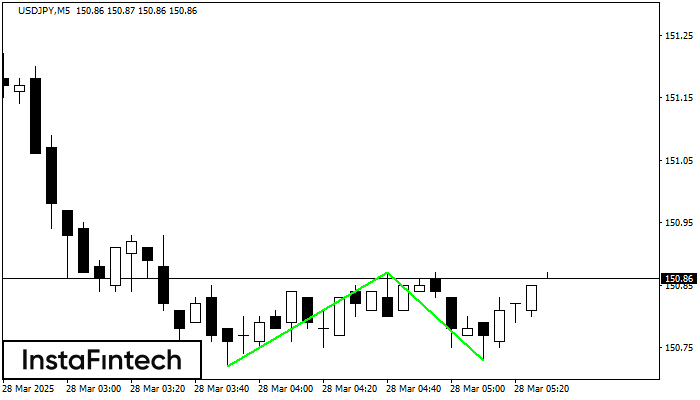
Сформирована фигура «Двойное дно» на графике USDJPY M5. Характеристика: Уровень поддержки 150.72; Уровень сопротивления 150.87; Ширина фигуры 15 пунктов. В случае пробоя уровня сопротивления можно будет прогнозировать изменение тенденции, где первая точка фиксации прибыли находится на расстоянии 14 пунктов.
Таймфреймы М5 и М15 могут иметь больше ложных точек входа.
- Все
- Все
- Bearish Rectangle
- Bearish Symmetrical Triangle
- Bearish Symmetrical Triangle
- Bullish Rectangle
- Double Top
- Double Top
- Triple Bottom
- Triple Bottom
- Triple Top
- Triple Top
- Все
- Все
- Покупка
- Продажа
- Все
- 1
- 2
- 3
- 4
- 5
Double Bottom
was formed on 13.06 at 05:30:28 (UTC+0)
signal strength 2 of 5
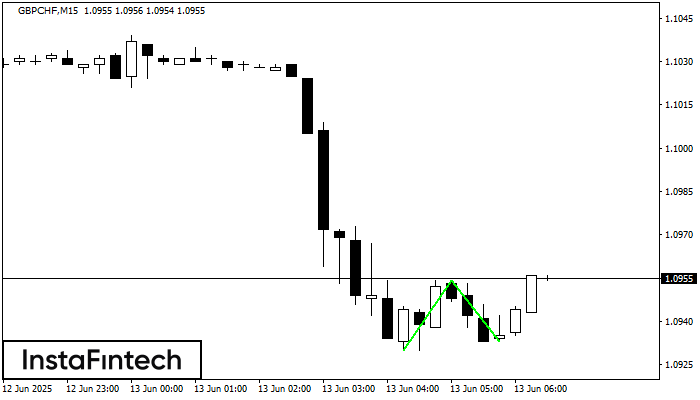
The Double Bottom pattern has been formed on GBPCHF M15. This formation signals a reversal of the trend from downwards to upwards. The signal is that a buy trade should
The M5 and M15 time frames may have more false entry points.
Open chart in a new window
Double Bottom
was formed on 13.06 at 05:30:27 (UTC+0)
signal strength 2 of 5

The Double Bottom pattern has been formed on EURCHF M15. Characteristics: the support level 0.9307; the resistance level 0.9330; the width of the pattern 23 points. If the resistance level
The M5 and M15 time frames may have more false entry points.
Open chart in a new window
Bullish Symmetrical Triangle
was formed on 13.06 at 05:21:56 (UTC+0)
signal strength 1 of 5

According to the chart of M5, NZDCAD formed the Bullish Symmetrical Triangle pattern, which signals the trend will continue. Description. The upper border of the pattern touches the coordinates 0.8254/0.8212
The M5 and M15 time frames may have more false entry points.
Open chart in a new window


