

Dolzarb patternlar

Двойная вершина
сформирован 27.03 в 04:40:34 (UTC+0)
сила сигнала 1 из 5
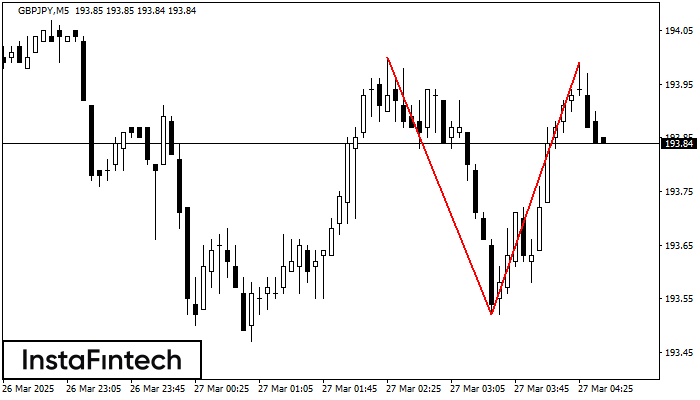
На торговом графике GBPJPY M5 сформировалась разворотная фигура «Двойная вершина». Характеристика: Верхняя граница 193.99; Нижняя граница 193.52; Ширина фигуры 47 пунктов. Сигнал: Пробой нижней границы 193.52 приведет к дальнейшему нисходящему движению с перспективой хода к уровню 193.37.
Таймфреймы М5 и М15 могут иметь больше ложных точек входа.
- Все
- Все
- Bearish Rectangle
- Bearish Symmetrical Triangle
- Bearish Symmetrical Triangle
- Bullish Rectangle
- Double Top
- Double Top
- Triple Bottom
- Triple Bottom
- Triple Top
- Triple Top
- Все
- Все
- Покупка
- Продажа
- Все
- 1
- 2
- 3
- 4
- 5
Triple Top
сформирован 15.06 в 02:10:13 (UTC+0)
сила сигнала 1 из 5
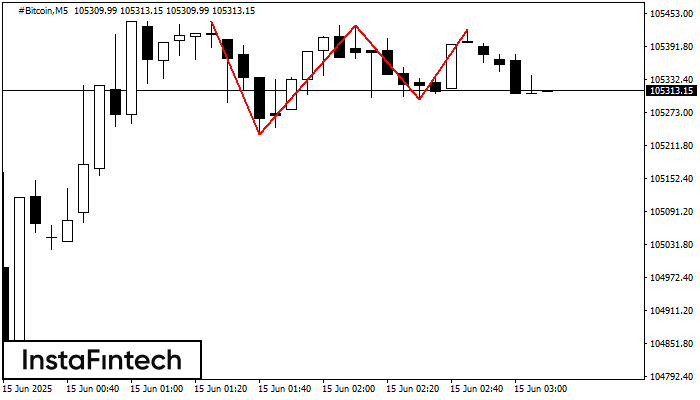
The Triple Top pattern has formed on the chart of the #Bitcoin M5 trading instrument. It is a reversal pattern featuring the following characteristics: resistance level 1384, support level -6448
The M5 and M15 time frames may have more false entry points.
Открыть график инструмента в новом окне
Double Top
сформирован 15.06 в 01:20:09 (UTC+0)
сила сигнала 1 из 5
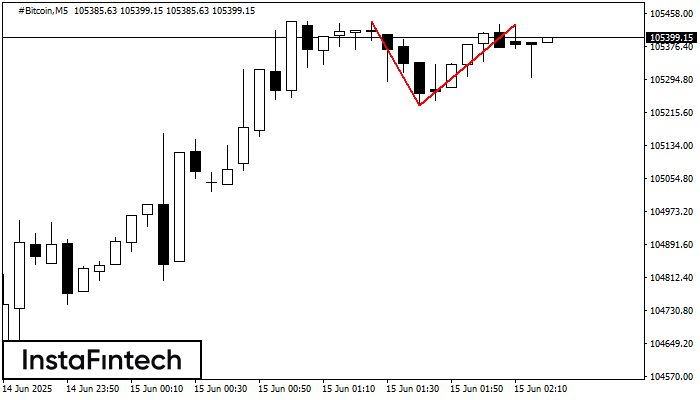
On the chart of #Bitcoin M5 the Double Top reversal pattern has been formed. Characteristics: the upper boundary 105430.30; the lower boundary 105231.35; the width of the pattern 19895 points
The M5 and M15 time frames may have more false entry points.
Открыть график инструмента в новом окне
Double Bottom
сформирован 14.06 в 21:00:24 (UTC+0)
сила сигнала 1 из 5
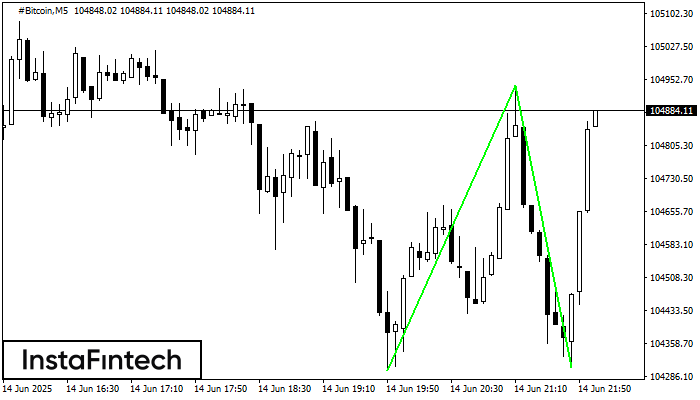
The Double Bottom pattern has been formed on #Bitcoin M5. Characteristics: the support level 104299.16; the resistance level 104939.96; the width of the pattern 64080 points. If the resistance level
The M5 and M15 time frames may have more false entry points.
Открыть график инструмента в новом окне


