

Dolzarb patternlar

Бычий симметричный треугольник
сформирован 27.03 в 01:21:01 (UTC+0)
сила сигнала 1 из 5
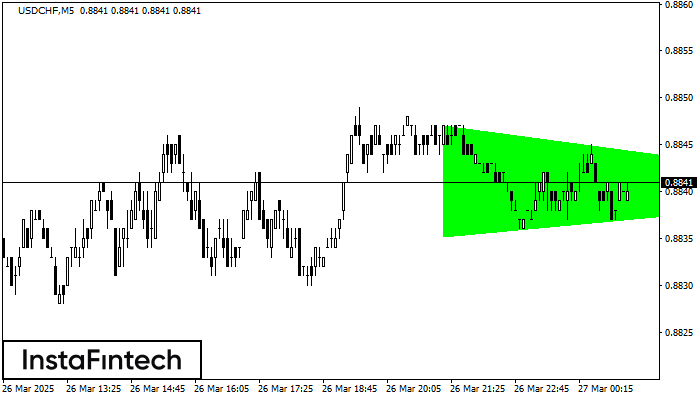
По USDCHF на M5 фигура «Бычий симметричный треугольник». Характеристика: Фигура продолжения тренда; Координаты границ – верхняя 0.8847, нижняя 0.8835. Проекция ширины фигуры 12 пунктов. Прогноз: В случае пробоя верхней границы 0.8847 цена, вероятнее всего, продолжит движение к 0.8855.
Таймфреймы М5 и М15 могут иметь больше ложных точек входа.
Shuningdek ko'ring
- Все
- Все
- Bearish Rectangle
- Bearish Symmetrical Triangle
- Bearish Symmetrical Triangle
- Bullish Rectangle
- Double Top
- Double Top
- Triple Bottom
- Triple Bottom
- Triple Top
- Triple Top
- Все
- Все
- Покупка
- Продажа
- Все
- 1
- 2
- 3
- 4
- 5
Bearish Rectangle
сформирован 10.04 в 14:40:41 (UTC+0)
сила сигнала 1 из 5
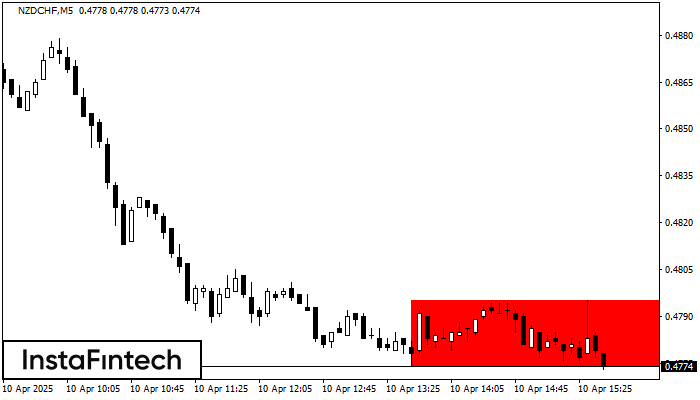
According to the chart of M5, NZDCHF formed the Bearish Rectangle. The pattern indicates a trend continuation. The upper border is 0.4795, the lower border is 0.4774. The signal means
The M5 and M15 time frames may have more false entry points.
Открыть график инструмента в новом окне
Bearish Rectangle
сформирован 10.04 в 14:40:16 (UTC+0)
сила сигнала 1 из 5
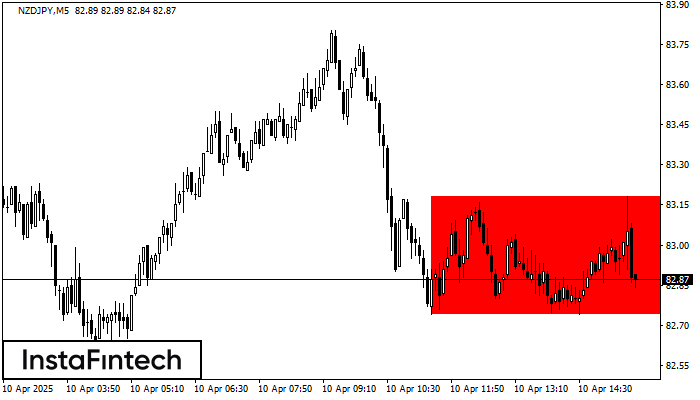
According to the chart of M5, NZDJPY formed the Bearish Rectangle. The pattern indicates a trend continuation. The upper border is 83.18, the lower border is 82.74. The signal means
The M5 and M15 time frames may have more false entry points.
Открыть график инструмента в новом окне
Bullish Symmetrical Triangle
сформирован 10.04 в 14:38:27 (UTC+0)
сила сигнала 1 из 5
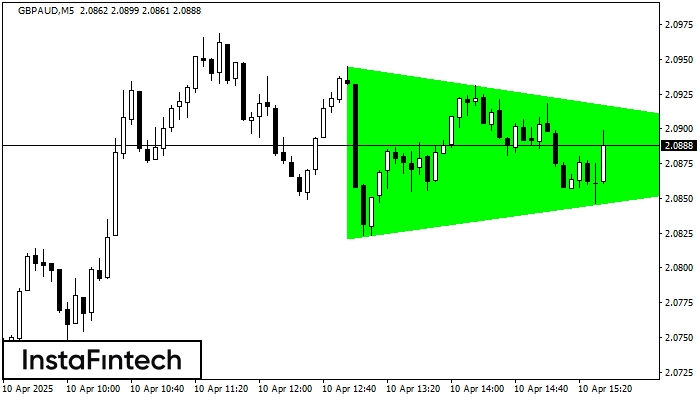
According to the chart of M5, GBPAUD formed the Bullish Symmetrical Triangle pattern. The lower border of the pattern touches the coordinates 2.0821/2.0880 whereas the upper border goes across 2.0945/2.0880
The M5 and M15 time frames may have more false entry points.
Открыть график инструмента в новом окне


