

Dolzarb patternlar

Двойное дно
сформирован 27.03 в 00:00:29 (UTC+0)
сила сигнала 3 из 5

Сформирована фигура «Двойное дно» на графике NZDCAD M30. Верхняя граница 0.8209; Нижняя граница 0.8165; Ширина фигуры 43 пунктов. В случае пробоя верхней границы 0.8209 можно будет прогнозировать изменение тенденции, где ширина фигуры и будет являться расстоянием предположительного Тейк Профита.
Shuningdek ko'ring
- Все
- Все
- Bearish Rectangle
- Bearish Symmetrical Triangle
- Bearish Symmetrical Triangle
- Bullish Rectangle
- Double Top
- Double Top
- Triple Bottom
- Triple Bottom
- Triple Top
- Triple Top
- Все
- Все
- Покупка
- Продажа
- Все
- 1
- 2
- 3
- 4
- 5
Double Bottom
сформирован 23.06 в 18:40:25 (UTC+0)
сила сигнала 1 из 5
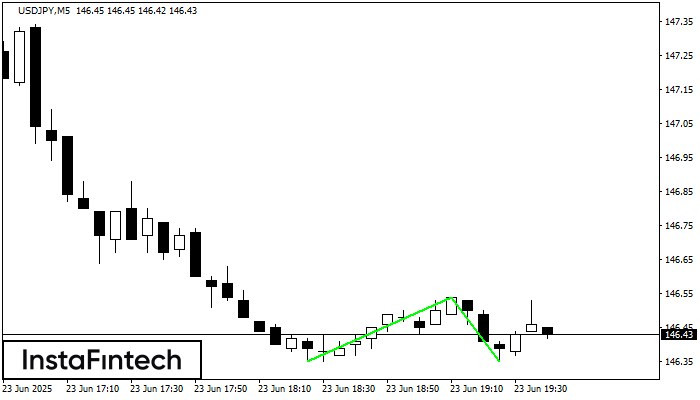
The Double Bottom pattern has been formed on USDJPY M5. This formation signals a reversal of the trend from downwards to upwards. The signal is that a buy trade should
The M5 and M15 time frames may have more false entry points.
Открыть график инструмента в новом окне
Head and Shoulders
сформирован 23.06 в 18:35:16 (UTC+0)
сила сигнала 1 из 5
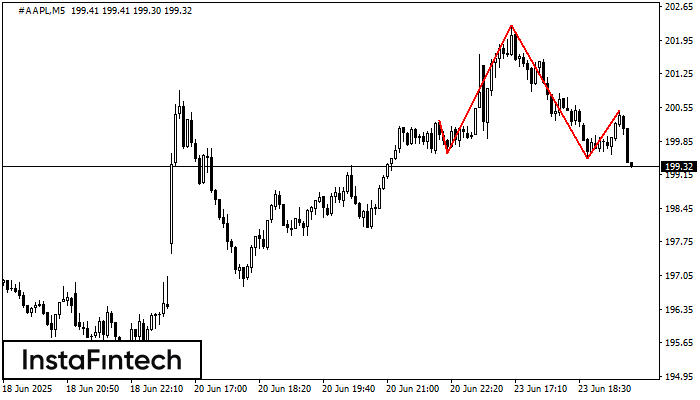
According to the chart of M5, #AAPL formed the Head and Shoulders pattern. The Head’s top is set at 202.25 while the median line of the Neck is found
The M5 and M15 time frames may have more false entry points.
Открыть график инструмента в новом окне
Bearish pennant
сформирован 23.06 в 17:15:37 (UTC+0)
сила сигнала 2 из 5
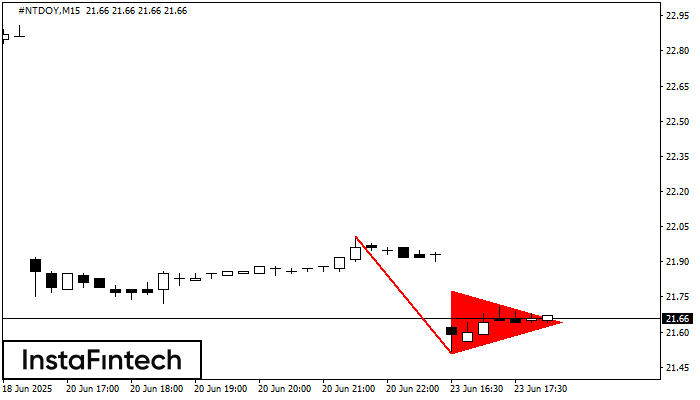
The Bearish pennant pattern has formed on the #NTDOY M15 chart. It signals potential continuation of the existing trend. Specifications: the pattern’s bottom has the coordinate of 21.51; the projection
The M5 and M15 time frames may have more false entry points.
Открыть график инструмента в новом окне


