

Dolzarb patternlar

Двойная вершина
сформирован 27.03 в 00:00:20 (UTC+0)
сила сигнала 5 из 5
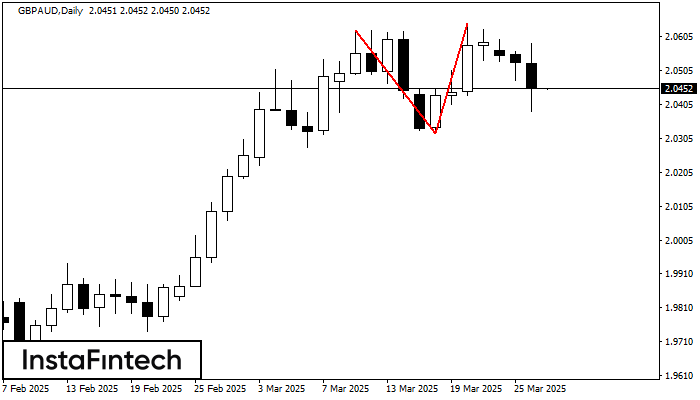
На торговом графике GBPAUD D1 сформировалась разворотная фигура «Двойная вершина». Характеристика: Верхняя граница 2.0644; Нижняя граница 2.0321; Ширина фигуры 323 пунктов. Сигнал: Пробой нижней границы 2.0321 приведет к дальнейшему нисходящему движению с перспективой хода к уровню 2.0281.
- Все
- Все
- Bearish Rectangle
- Bearish Symmetrical Triangle
- Bearish Symmetrical Triangle
- Bullish Rectangle
- Double Top
- Double Top
- Triple Bottom
- Triple Bottom
- Triple Top
- Triple Top
- Все
- Все
- Покупка
- Продажа
- Все
- 1
- 2
- 3
- 4
- 5
Triple Top
was formed on 18.06 at 06:00:32 (UTC+0)
signal strength 2 of 5
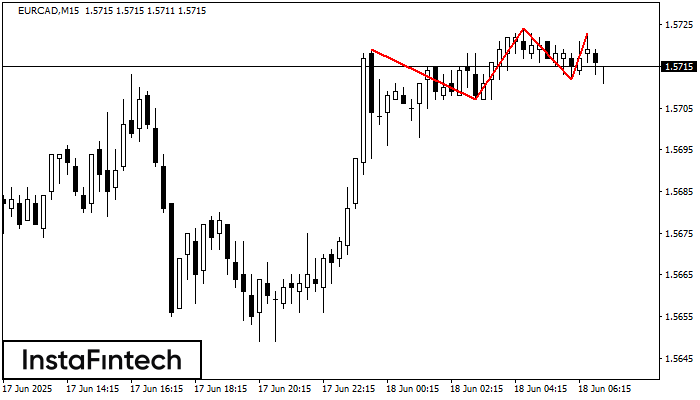
The Triple Top pattern has formed on the chart of the EURCAD M15. Features of the pattern: borders have an ascending angle; the lower line of the pattern
The M5 and M15 time frames may have more false entry points.
Open chart in a new window
Double Bottom
was formed on 18.06 at 05:45:02 (UTC+0)
signal strength 2 of 5
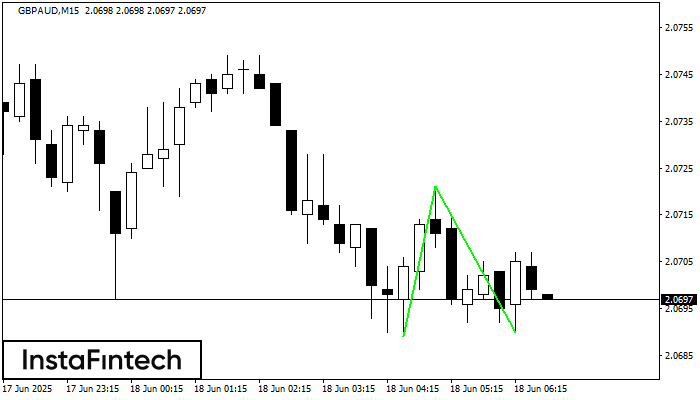
The Double Bottom pattern has been formed on GBPAUD M15; the upper boundary is 2.0721; the lower boundary is 2.0690. The width of the pattern is 32 points. In case
The M5 and M15 time frames may have more false entry points.
Open chart in a new window
Bearish Rectangle
was formed on 18.06 at 05:44:08 (UTC+0)
signal strength 1 of 5
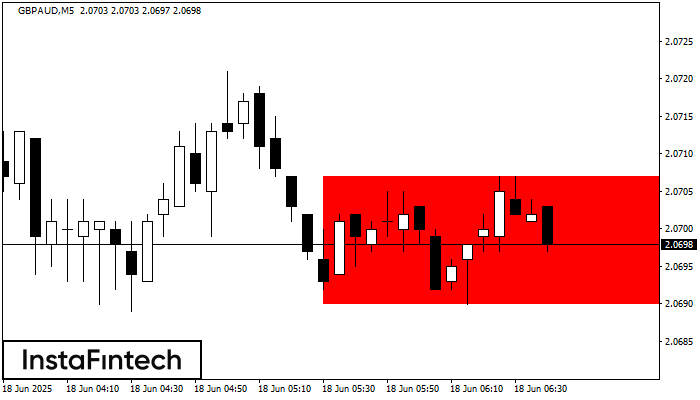
According to the chart of M5, GBPAUD formed the Bearish Rectangle. The pattern indicates a trend continuation. The upper border is 2.0707, the lower border is 2.0690. The signal means
The M5 and M15 time frames may have more false entry points.
Open chart in a new window


