

Dolzarb patternlar

Двойное дно
сформирован 27.03 в 00:00:09 (UTC+0)
сила сигнала 4 из 5
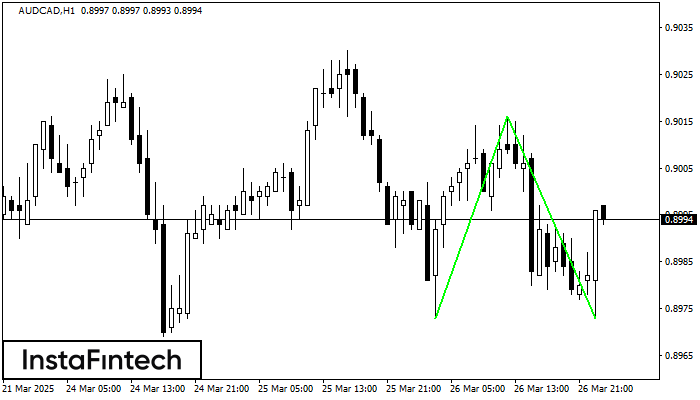
Сформирована фигура «Двойное дно» на графике AUDCAD H1. Верхняя граница 0.9016; Нижняя граница 0.8973; Ширина фигуры 43 пунктов. В случае пробоя верхней границы 0.9016 можно будет прогнозировать изменение тенденции, где ширина фигуры и будет являться расстоянием предположительного Тейк Профита.
- Все
- Все
- Bearish Rectangle
- Bearish Symmetrical Triangle
- Bearish Symmetrical Triangle
- Bullish Rectangle
- Double Top
- Double Top
- Triple Bottom
- Triple Bottom
- Triple Top
- Triple Top
- Все
- Все
- Покупка
- Продажа
- Все
- 1
- 2
- 3
- 4
- 5
Triple Top
сформирован 18.06 в 20:55:16 (UTC+0)
сила сигнала 1 из 5
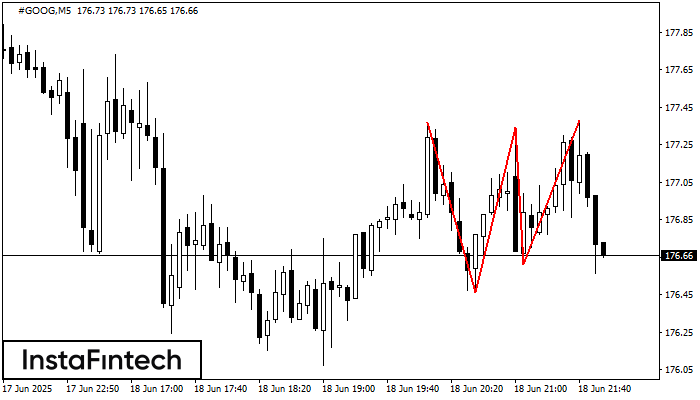
The Triple Top pattern has formed on the chart of the #GOOG M5. Features of the pattern: borders have an ascending angle; the lower line of the pattern
The M5 and M15 time frames may have more false entry points.
Открыть график инструмента в новом окне
Bearish Rectangle
сформирован 18.06 в 20:16:26 (UTC+0)
сила сигнала 2 из 5
According to the chart of M15, #PEP formed the Bearish Rectangle which is a pattern of a trend continuation. The pattern is contained within the following borders: lower border 128.62
The M5 and M15 time frames may have more false entry points.
Открыть график инструмента в новом окне
Bearish Rectangle
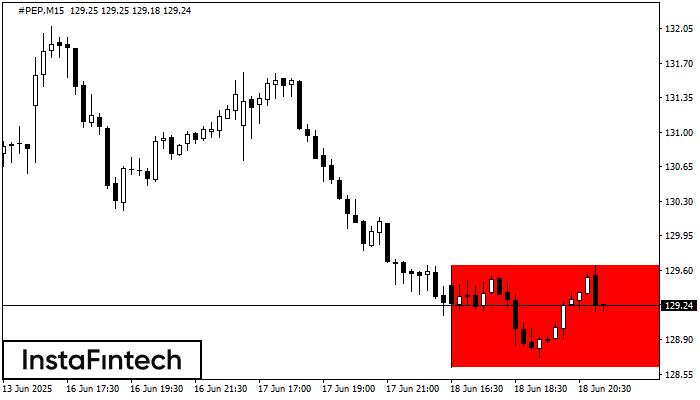
сформирован 18.06 в 20:16:24 (UTC+0)
сила сигнала 2 из 5

According to the chart of M15, #PEP formed the Bearish Rectangle. The pattern indicates a trend continuation. The upper border is 129.65, the lower border is 128.62. The signal means
The M5 and M15 time frames may have more false entry points.
Открыть график инструмента в новом окне
