

Dolzarb patternlar

Двойное дно
сформирован 26.03 в 01:30:17 (UTC+0)
сила сигнала 1 из 5
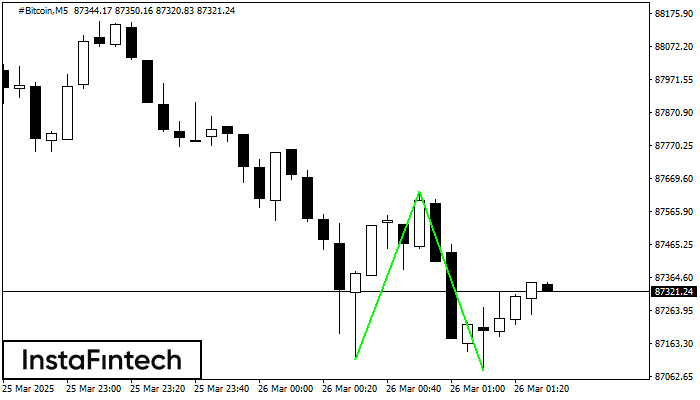
Сформирована фигура «Двойное дно» на графике #Bitcoin M5. Характеристика: Уровень поддержки 87112.77; Уровень сопротивления 87627.18; Ширина фигуры 51441 пунктов. В случае пробоя уровня сопротивления можно будет прогнозировать изменение тенденции, где первая точка фиксации прибыли находится на расстоянии 54686 пунктов.
Таймфреймы М5 и М15 могут иметь больше ложных точек входа.
- Все
- Все
- Bearish Rectangle
- Bearish Symmetrical Triangle
- Bearish Symmetrical Triangle
- Bullish Rectangle
- Double Top
- Double Top
- Triple Bottom
- Triple Bottom
- Triple Top
- Triple Top
- Все
- Все
- Покупка
- Продажа
- Все
- 1
- 2
- 3
- 4
- 5
Double Bottom
сформирован 12.05 в 23:15:09 (UTC+0)
сила сигнала 1 из 5
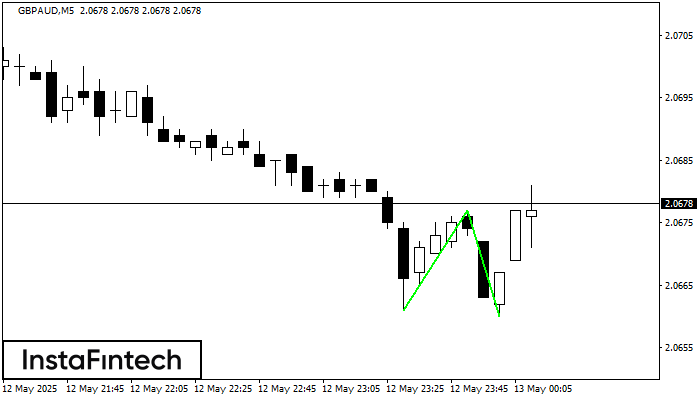
The Double Bottom pattern has been formed on GBPAUD M5; the upper boundary is 2.0677; the lower boundary is 2.0660. The width of the pattern is 16 points. In case
The M5 and M15 time frames may have more false entry points.
Открыть график инструмента в новом окне
Double Top
сформирован 12.05 в 22:00:17 (UTC+0)
сила сигнала 3 из 5
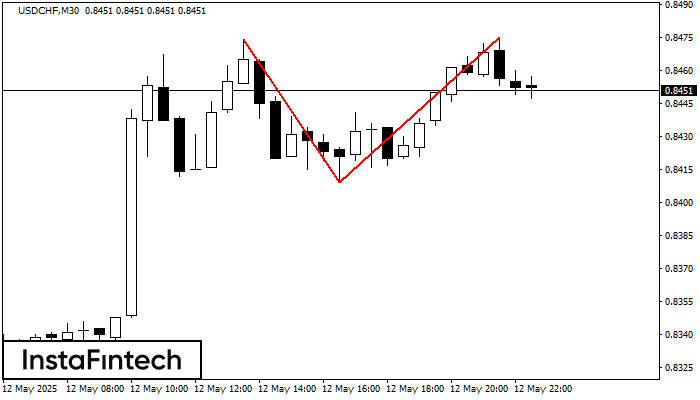
On the chart of USDCHF M30 the Double Top reversal pattern has been formed. Characteristics: the upper boundary 0.8475; the lower boundary 0.8409; the width of the pattern 66 points
Открыть график инструмента в новом окне
Triple Bottom
сформирован 12.05 в 21:55:25 (UTC+0)
сила сигнала 1 из 5
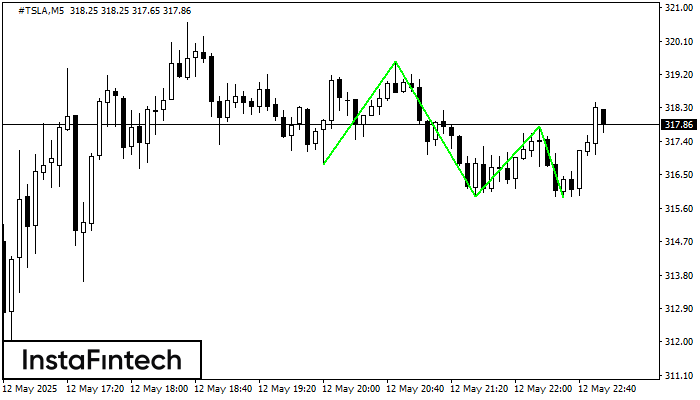
The Triple Bottom pattern has been formed on #TSLA M5. It has the following characteristics: resistance level 319.55/317.80; support level 316.79/315.89; the width is 276 points. In the event
The M5 and M15 time frames may have more false entry points.
Открыть график инструмента в новом окне


