

Dolzarb patternlar

Двойная вершина
сформирован 25.03 в 22:17:10 (UTC+0)
сила сигнала 2 из 5
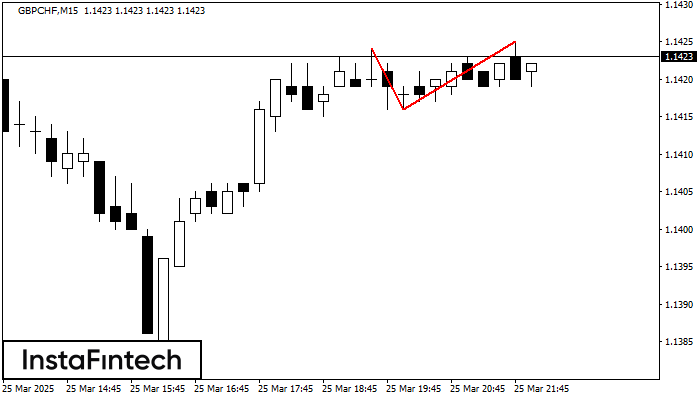
На торговом графике GBPCHF M15 сформировалась разворотная фигура «Двойная вершина». Характеристика: Верхняя граница 1.1425; Нижняя граница 1.1416; Ширина фигуры 9 пунктов. Сигнал: Пробой нижней границы 1.1416 приведет к дальнейшему нисходящему движению с перспективой хода к уровню 1.1394.
Таймфреймы М5 и М15 могут иметь больше ложных точек входа.
Shuningdek ko'ring
- Все
- Все
- Bearish Rectangle
- Bearish Symmetrical Triangle
- Bearish Symmetrical Triangle
- Bullish Rectangle
- Double Top
- Double Top
- Triple Bottom
- Triple Bottom
- Triple Top
- Triple Top
- Все
- Все
- Покупка
- Продажа
- Все
- 1
- 2
- 3
- 4
- 5
Bullish pennant
сформирован 09.06 в 07:14:41 (UTC+0)
сила сигнала 1 из 5
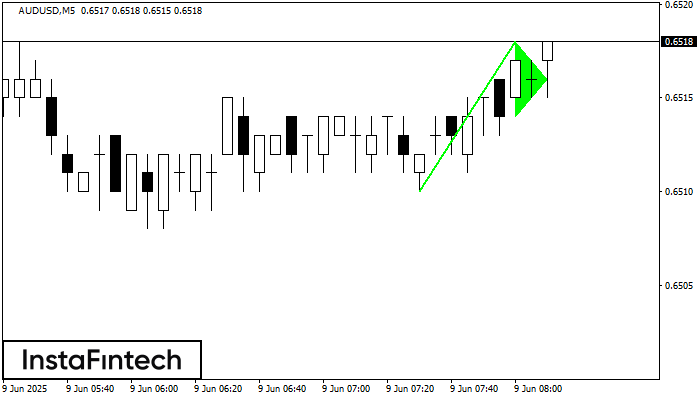
The Bullish pennant signal – Trading instrument AUDUSD M5, continuation pattern. Forecast: it is possible to set up a buy position above the pattern’s high of 0.6518, with the prospect
The M5 and M15 time frames may have more false entry points.
Открыть график инструмента в новом окне
Double Top
сформирован 09.06 в 07:00:24 (UTC+0)
сила сигнала 4 из 5
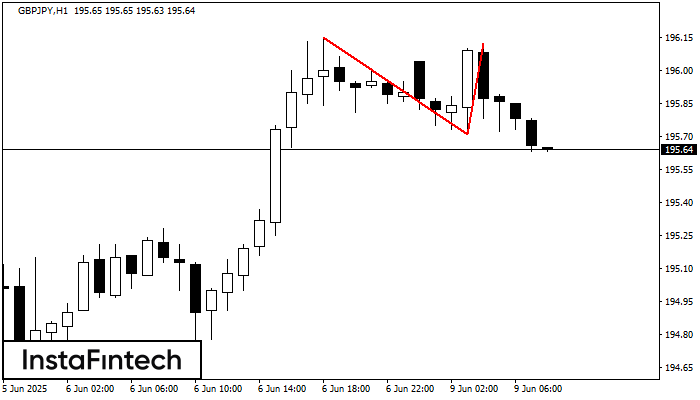
On the chart of GBPJPY H1 the Double Top reversal pattern has been formed. Characteristics: the upper boundary 196.12; the lower boundary 195.71; the width of the pattern 41 points
Открыть график инструмента в новом окне
Bearish Rectangle
сформирован 09.06 в 05:50:35 (UTC+0)
сила сигнала 1 из 5
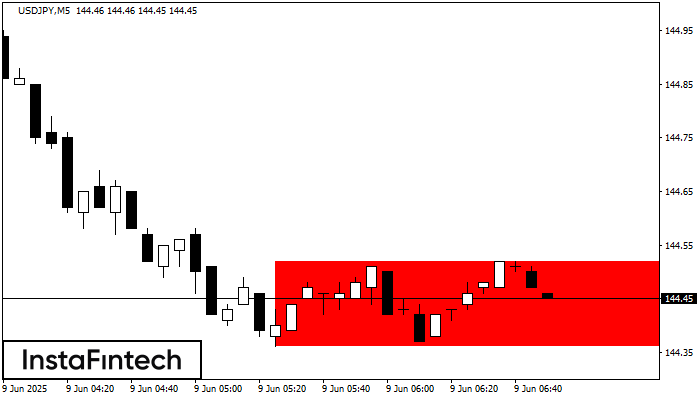
According to the chart of M5, USDJPY formed the Bearish Rectangle. This type of a pattern indicates a trend continuation. It consists of two levels: resistance 144.52 - 0.00
The M5 and M15 time frames may have more false entry points.
Открыть график инструмента в новом окне


