

Dolzarb patternlar

Прямоугольник
сформирован 21.03 в 21:46:26 (UTC+0)
сила сигнала 1 из 5

По торговому инструменту USDCAD на M5 сформировалась фигура продолжения тренда - «Прямоугольник». Фигура имеет границы: Нижняя 1.4338; Верхняя 1.4351. В случае пробоя нижней границы вероятно дальнейшее движение в сторону тренда.
Таймфреймы М5 и М15 могут иметь больше ложных точек входа.
- Все
- Все
- Bearish Rectangle
- Bearish Symmetrical Triangle
- Bearish Symmetrical Triangle
- Bullish Rectangle
- Double Top
- Double Top
- Triple Bottom
- Triple Bottom
- Triple Top
- Triple Top
- Все
- Все
- Покупка
- Продажа
- Все
- 1
- 2
- 3
- 4
- 5
Прямоугольник
сформирован 23.05 в 12:51:48 (UTC+0)
сила сигнала 2 из 5
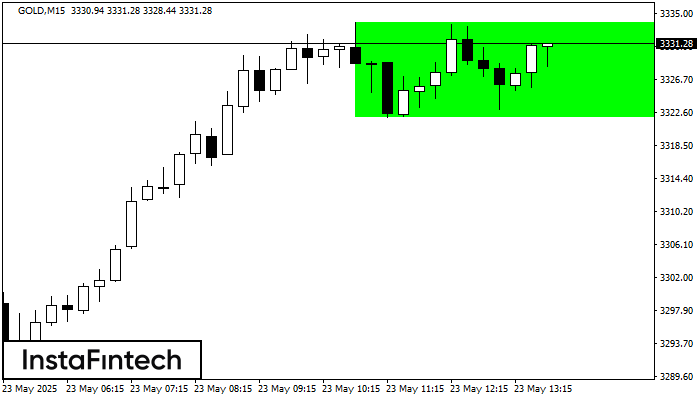
По торговому инструменту GOLD на M15 сформировалась фигура продолжения тренда - «Прямоугольник». Фигура имеет границы: Нижняя 3322.04; Верхняя 3333.94. В случае пробоя верхней границы вероятно дальнейшее движение в сторону тренда
Таймфреймы М5 и М15 могут иметь больше ложных точек входа.
Открыть график инструмента в новом окне
Бычий вымпел
сформирован 23.05 в 12:40:29 (UTC+0)
сила сигнала 3 из 5
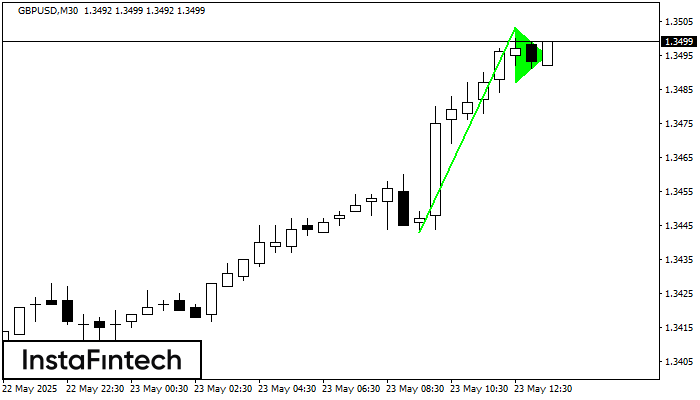
Сигнал «Бычий вымпел» – Торговый инструмент GBPUSD M30, фигура продолжения тенденции. Прогноз: позицию на покупку можно открывать выше максимума фигуры 1.3503, где перспектива будущего хода будет являться проекцией высоты флагштока
Открыть график инструмента в новом окне
Прямоугольник
сформирован 23.05 в 12:37:49 (UTC+0)
сила сигнала 1 из 5
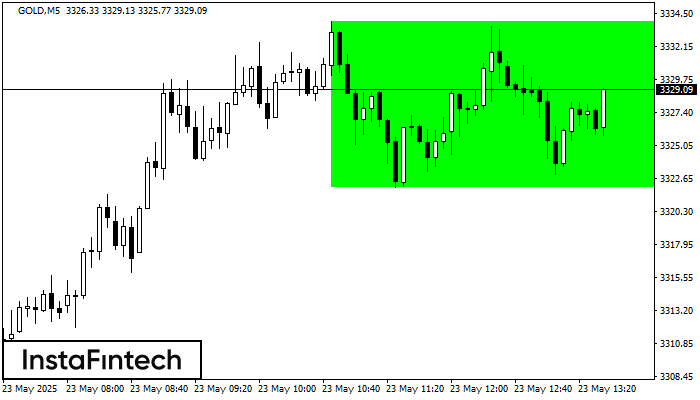
По GOLD на M5 сформировалась фигура «Прямоугольник». Фигура данного типа относится к тому типу продолжения тренда, который содержит в себе два уровня: Сопротивление 3333.94; Поддержка 3322.04. В случае пробоя уровня
Таймфреймы М5 и М15 могут иметь больше ложных точек входа.
Открыть график инструмента в новом окне


