

Dolzarb patternlar

Актуальные паттерны
- Все
- Все
- Bearish Rectangle
- Bearish Symmetrical Triangle
- Bearish Symmetrical Triangle
- Bullish Rectangle
- Double Top
- Double Top
- Triple Bottom
- Triple Bottom
- Triple Top
- Triple Top
- Все
- Все
- Покупка
- Продажа
- Все
- 1
- 2
- 3
- 4
- 5
Bullish pennant
сформирован 25.04 в 14:40:52 (UTC+0)
сила сигнала 1 из 5
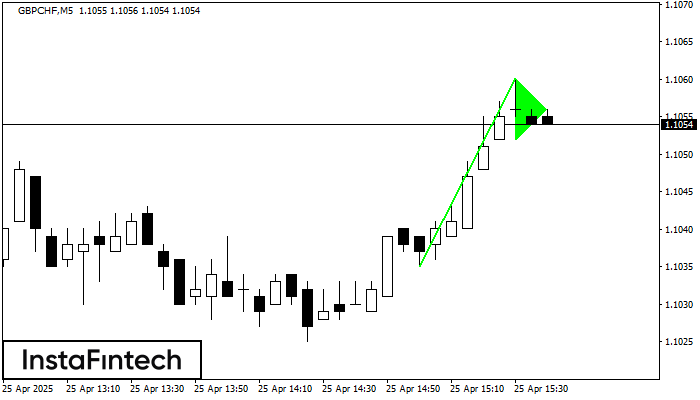
The Bullish pennant graphic pattern has formed on the GBPCHF M5 instrument. This pattern type falls under the category of continuation patterns. In this case, if the quote can breaks
The M5 and M15 time frames may have more false entry points.
Открыть график инструмента в новом окне
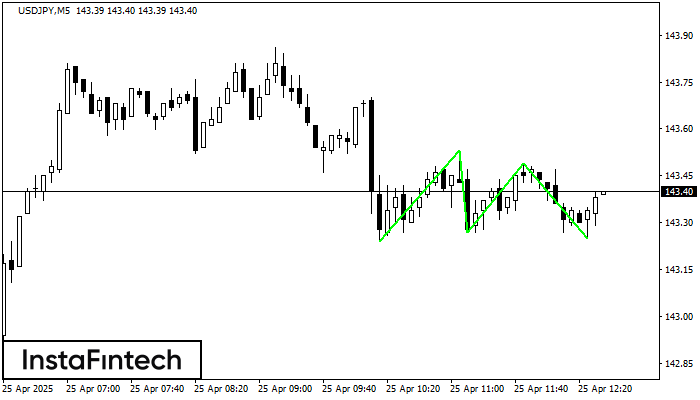
Double Bottom
сформирован 25.04 в 13:45:23 (UTC+0)
сила сигнала 1 из 5
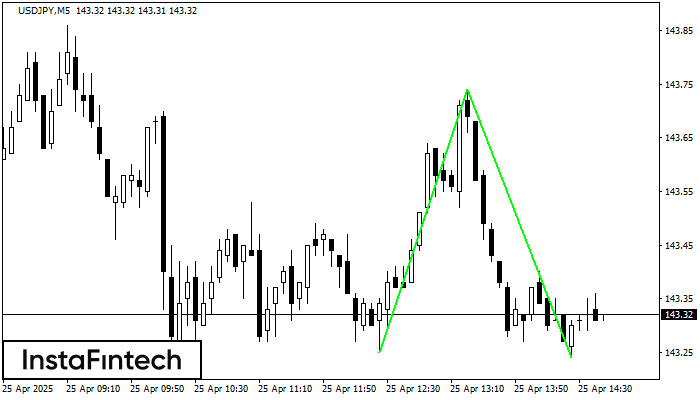
The Double Bottom pattern has been formed on USDJPY M5. Characteristics: the support level 143.25; the resistance level 143.74; the width of the pattern 49 points. If the resistance level
The M5 and M15 time frames may have more false entry points.
Открыть график инструмента в новом окне
Triple Bottom
сформирован 25.04 в 12:29:55 (UTC+0)
сила сигнала 2 из 5

The Triple Bottom pattern has formed on the chart of GOLD M15. Features of the pattern: The lower line of the pattern has coordinates 3314.04 with the upper limit 3314.04/3308.41
The M5 and M15 time frames may have more false entry points.
Открыть график инструмента в новом окне
Triple Bottom
сформирован 25.04 в 11:55:08 (UTC+0)
сила сигнала 1 из 5
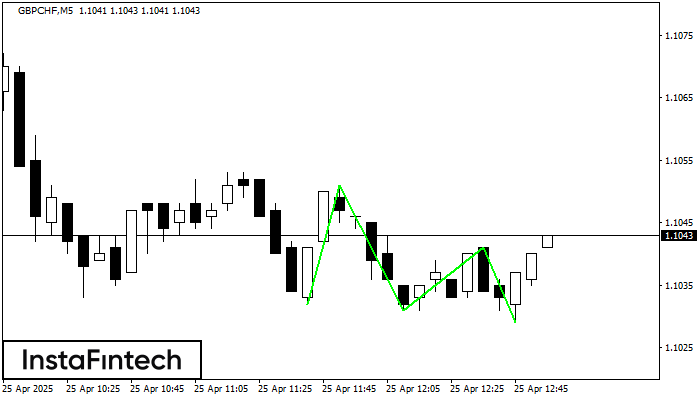
The Triple Bottom pattern has been formed on GBPCHF M5. It has the following characteristics: resistance level 1.1051/1.1041; support level 1.1032/1.1029; the width is 19 points. In the event
The M5 and M15 time frames may have more false entry points.
Открыть график инструмента в новом окне
Double Top
сформирован 25.04 в 11:40:02 (UTC+0)
сила сигнала 1 из 5
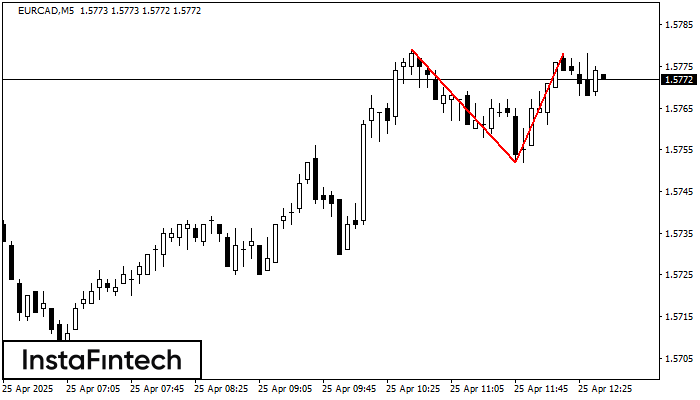
On the chart of EURCAD M5 the Double Top reversal pattern has been formed. Characteristics: the upper boundary 1.5778; the lower boundary 1.5752; the width of the pattern 26 points
The M5 and M15 time frames may have more false entry points.
Открыть график инструмента в новом окне
Triple Bottom
сформирован 25.04 в 11:34:47 (UTC+0)
сила сигнала 1 из 5
The Triple Bottom pattern has been formed on USDJPY M5. It has the following characteristics: resistance level 143.53/143.49; support level 143.24/143.25; the width is 29 points. In the event
The M5 and M15 time frames may have more false entry points.
Открыть график инструмента в новом окне
Head and Shoulders
сформирован 25.04 в 11:16:23 (UTC+0)
сила сигнала 2 из 5

The technical pattern called Head and Shoulders has appeared on the chart of USDCHF M15. There are weighty reasons to suggest that the price will surpass the Neckline 0.8293/0.8295 after
The M5 and M15 time frames may have more false entry points.
Открыть график инструмента в новом окне
Double Bottom
сформирован 25.04 в 11:00:37 (UTC+0)
сила сигнала 1 из 5
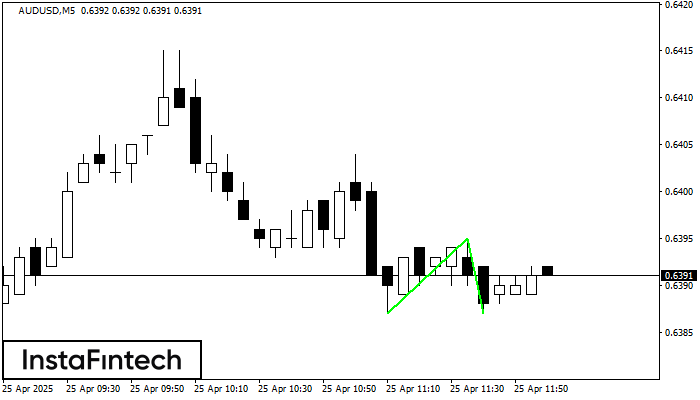
The Double Bottom pattern has been formed on AUDUSD M5. This formation signals a reversal of the trend from downwards to upwards. The signal is that a buy trade should
The M5 and M15 time frames may have more false entry points.
Открыть график инструмента в новом окне
Double Bottom
сформирован 25.04 в 10:50:23 (UTC+0)
сила сигнала 1 из 5
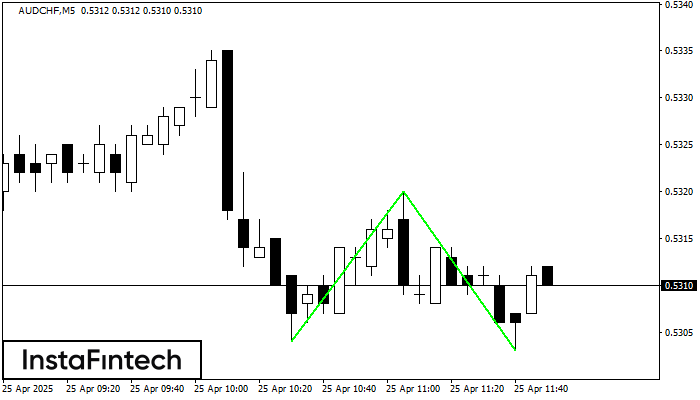
The Double Bottom pattern has been formed on AUDCHF M5. Characteristics: the support level 0.5304; the resistance level 0.5320; the width of the pattern 16 points. If the resistance level
The M5 and M15 time frames may have more false entry points.
Открыть график инструмента в новом окне


