

Актуальні патерни

Патерни - це графічні моделі, які "малюють" ціни на графіку. Один з постулатів технічного аналізу говорить нам про те, що історія (рух ціни) завжди повторюється. Це означає, що в схожих ситуаціях рух ціни, найчастіше, буде схожим, що дозволяє з високою часткою ймовірності спрогнозувати подальший розвиток ситуації.
Актуальні патерни від ІнстаФорекс - це зручний сервіс, який дозволить вам завжди бути в курсі останніх змін на ринку і вчасно реагувати на підказки, що з'явилися, від ринку. У нашому сервісі ви завжди знайдете найсвіжіші і актуальніші патерни на будь-якій парі і на будь-якому таймфреймі.
Прямоугольник
сформирован 24.04 в 12:34:50 (UTC+0)
сила сигнала 1 из 5
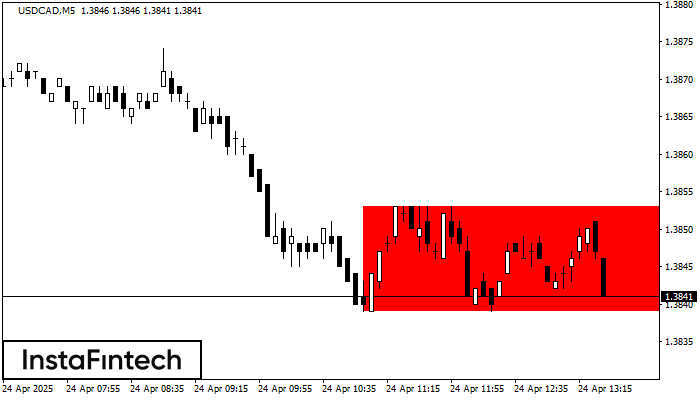
По торговому инструменту USDCAD на M5 сформировалась фигура продолжения тренда - «Прямоугольник». Фигура имеет границы: Нижняя 1.3839; Верхняя 1.3853. В случае пробоя нижней границы вероятно дальнейшее движение в сторону тренда.
Таймфреймы М5 и М15 могут иметь больше ложных точек входа.
- Все
- Все
- Bearish Rectangle
- Bearish Symmetrical Triangle
- Bearish Symmetrical Triangle
- Bullish Rectangle
- Double Top
- Double Top
- Triple Bottom
- Triple Bottom
- Triple Top
- Triple Top
- Все
- Все
- Покупка
- Продажа
- Все
- 1
- 2
- 3
- 4
- 5
Double Bottom
was formed on 07.05 at 01:00:48 (UTC+0)
signal strength 4 of 5
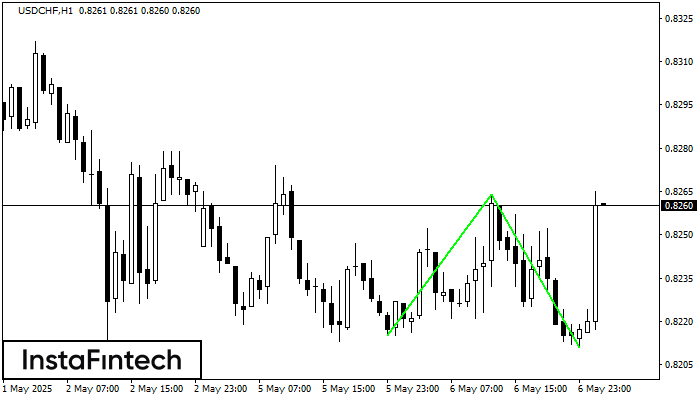
The Double Bottom pattern has been formed on USDCHF H1; the upper boundary is 0.8264; the lower boundary is 0.8211. The width of the pattern is 49 points. In case
Open chart in a new window
Double Bottom
was formed on 07.05 at 01:00:39 (UTC+0)
signal strength 4 of 5
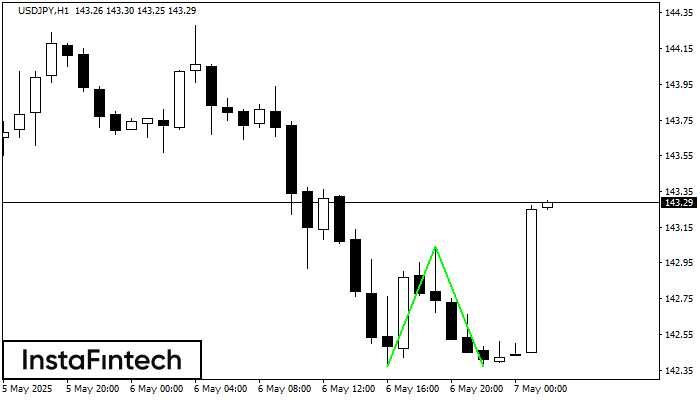
The Double Bottom pattern has been formed on USDJPY H1. Characteristics: the support level 142.37; the resistance level 143.04; the width of the pattern 67 points. If the resistance level
Open chart in a new window
Triple Top
was formed on 07.05 at 01:00:22 (UTC+0)
signal strength 4 of 5
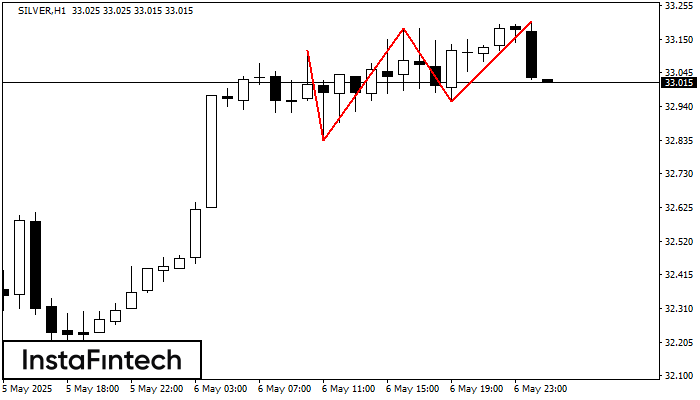
The Triple Top pattern has formed on the chart of the SILVER H1. Features of the pattern: borders have an ascending angle; the lower line of the pattern
Open chart in a new window


