

Актуальні патерни

Патерни - це графічні моделі, які "малюють" ціни на графіку. Один з постулатів технічного аналізу говорить нам про те, що історія (рух ціни) завжди повторюється. Це означає, що в схожих ситуаціях рух ціни, найчастіше, буде схожим, що дозволяє з високою часткою ймовірності спрогнозувати подальший розвиток ситуації.
Актуальні патерни від ІнстаФорекс - це зручний сервіс, який дозволить вам завжди бути в курсі останніх змін на ринку і вчасно реагувати на підказки, що з'явилися, від ринку. У нашому сервісі ви завжди знайдете найсвіжіші і актуальніші патерни на будь-якій парі і на будь-якому таймфреймі.
Бычий вымпел
сформирован 15.04 в 20:46:24 (UTC+0)
сила сигнала 3 из 5
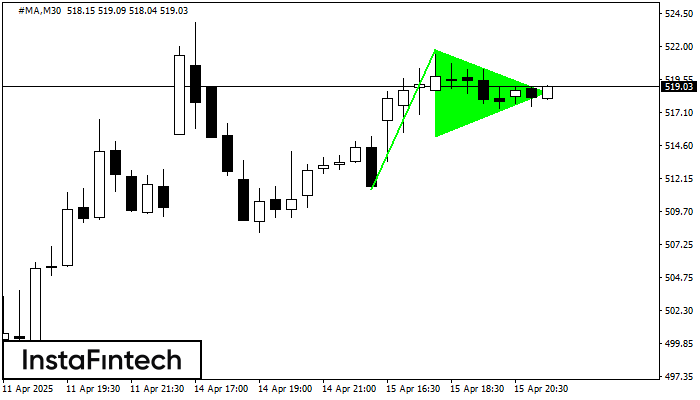
Сигнал «Бычий вымпел» – Торговый инструмент #MA M30, фигура продолжения тенденции. Прогноз: позицию на покупку можно открывать выше максимума фигуры 521.82, где перспектива будущего хода будет являться проекцией высоты флагштока.
- Все
- Все
- Bearish Rectangle
- Bearish Symmetrical Triangle
- Bearish Symmetrical Triangle
- Bullish Rectangle
- Double Top
- Double Top
- Triple Bottom
- Triple Bottom
- Triple Top
- Triple Top
- Все
- Все
- Покупка
- Продажа
- Все
- 1
- 2
- 3
- 4
- 5
Bearish Symmetrical Triangle
was formed on 08.05 at 14:35:35 (UTC+0)
signal strength 1 of 5
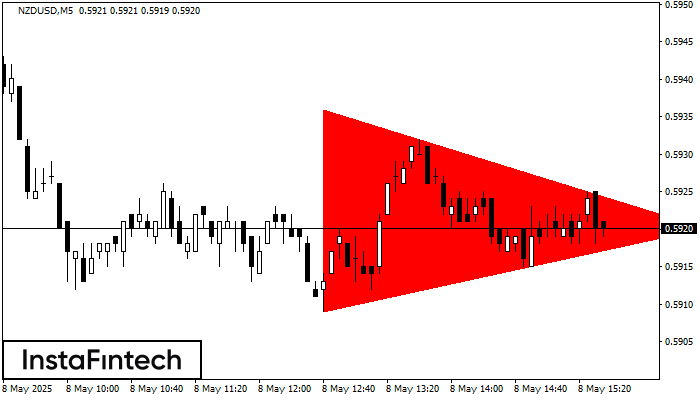
According to the chart of M5, NZDUSD formed the Bearish Symmetrical Triangle pattern. This pattern signals a further downward trend in case the lower border 0.5909 is breached. Here
The M5 and M15 time frames may have more false entry points.
Open chart in a new window
Double Bottom
was formed on 08.05 at 14:10:47 (UTC+0)
signal strength 1 of 5
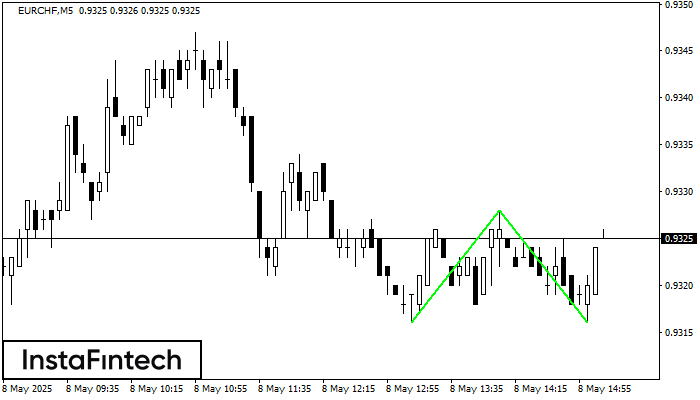
The Double Bottom pattern has been formed on EURCHF M5. Characteristics: the support level 0.9316; the resistance level 0.9328; the width of the pattern 12 points. If the resistance level
The M5 and M15 time frames may have more false entry points.
Open chart in a new window
Triple Bottom
was formed on 08.05 at 12:20:35 (UTC+0)
signal strength 1 of 5

The Triple Bottom pattern has formed on the chart of GBPCHF M5. Features of the pattern: The lower line of the pattern has coordinates 1.0970 with the upper limit 1.0970/1.0964
The M5 and M15 time frames may have more false entry points.
Open chart in a new window


