

Актуальні патерни

Патерни - це графічні моделі, які "малюють" ціни на графіку. Один з постулатів технічного аналізу говорить нам про те, що історія (рух ціни) завжди повторюється. Це означає, що в схожих ситуаціях рух ціни, найчастіше, буде схожим, що дозволяє з високою часткою ймовірності спрогнозувати подальший розвиток ситуації.
Актуальні патерни від ІнстаФорекс - це зручний сервіс, який дозволить вам завжди бути в курсі останніх змін на ринку і вчасно реагувати на підказки, що з'явилися, від ринку. У нашому сервісі ви завжди знайдете найсвіжіші і актуальніші патерни на будь-якій парі і на будь-якому таймфреймі.
Прямоугольник
сформирован 02.04 в 04:46:22 (UTC+0)
сила сигнала 1 из 5
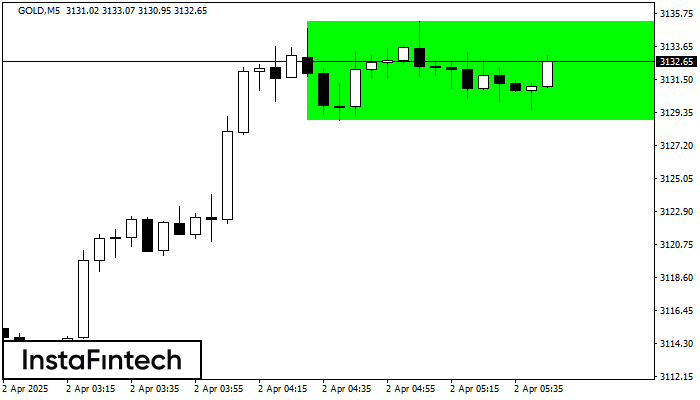
По торговому инструменту GOLD на M5 сформировалась фигура продолжения тренда - «Прямоугольник». Фигура имеет границы: Нижняя 3128.79; Верхняя 3135.25. В случае пробоя верхней границы вероятно дальнейшее движение в сторону тренда.
Таймфреймы М5 и М15 могут иметь больше ложных точек входа.
Дивіться також
- Все
- Все
- Bearish Rectangle
- Bearish Symmetrical Triangle
- Bearish Symmetrical Triangle
- Bullish Rectangle
- Double Top
- Double Top
- Triple Bottom
- Triple Bottom
- Triple Top
- Triple Top
- Все
- Все
- Покупка
- Продажа
- Все
- 1
- 2
- 3
- 4
- 5
Head and Shoulders
was formed on 14.05 at 19:30:34 (UTC+0)
signal strength 1 of 5

The technical pattern called Head and Shoulders has appeared on the chart of GBPCHF M5. There are weighty reasons to suggest that the price will surpass the Neckline 1.1164/1.1166 after
The M5 and M15 time frames may have more false entry points.
Open chart in a new window
Double Top
was formed on 14.05 at 19:30:23 (UTC+0)
signal strength 4 of 5
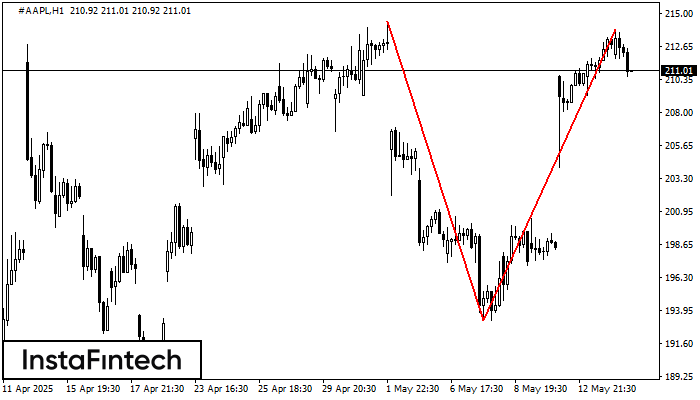
The Double Top pattern has been formed on #AAPL H1. It signals that the trend has been changed from upwards to downwards. Probably, if the base of the pattern 193.24
Open chart in a new window
Double Bottom
was formed on 14.05 at 19:04:05 (UTC+0)
signal strength 1 of 5
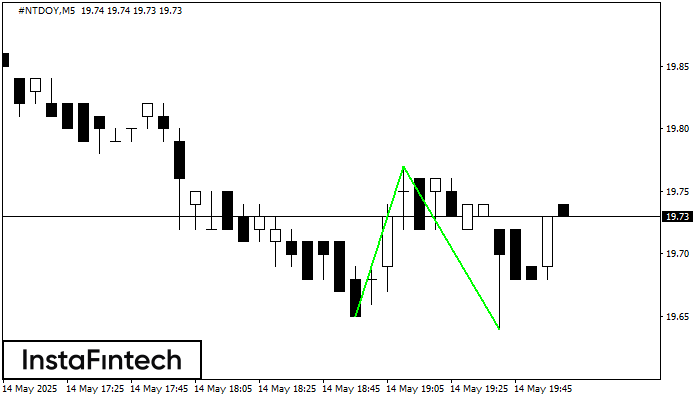
The Double Bottom pattern has been formed on #NTDOY M5. This formation signals a reversal of the trend from downwards to upwards. The signal is that a buy trade should
The M5 and M15 time frames may have more false entry points.
Open chart in a new window


