

รูปแบบกราฟ

รูปแบบกราฟนั้นเป็น รูปจำลองทางกราฟฟิกที่ถูกสร้างขึ้นมาในชาร์ตจากราคา อ้างอิงตามหนึ่งในการวิเคราะห์ทางเทคนิค ที่ตั้งสมมติฐานมาว่า ประวัติศาสตร์ (การเคลื่อนไหวของราคา) มักจะเกิดขึ้นซ้ำรอยเดิม นั้นหมายความว่า การเคลื่อนไหวของราคาก็หมือนกับ สถานการณ์หนึ่งที่จะสามารถทำการคาดการณ์ไปยังทิศทางในอนาคต ตามเหตุการณ์ที่น่าจะมีความเป็นไปได้สูง
รูปแบบกราฟที่สำคัญจากทาง InstaTrade นั้นจะเป็นการบริการที่มีการใช้อย่างง่ายดาย ซึ่งจะช่วยให้คุณสามารถทราบถึงการเปลี่ยนแปลงล่าสุด ในตลาดได้ และสามารถรับมือกับข้อมูลจากทางตลาดได้ทันท่วงที ในการบริการของพวกเรานั้น คุณจะพบกับรูปแบบกราฟล่าสุดและมีความสำคัญมากที่สุดในทุกๆคู่สกุลเงิน และทุกๆขอบเขตเวลา
Bullish Symmetrical Triangle
was formed on 15.04 at 00:15:23 (UTC+0)
signal strength 2 of 5
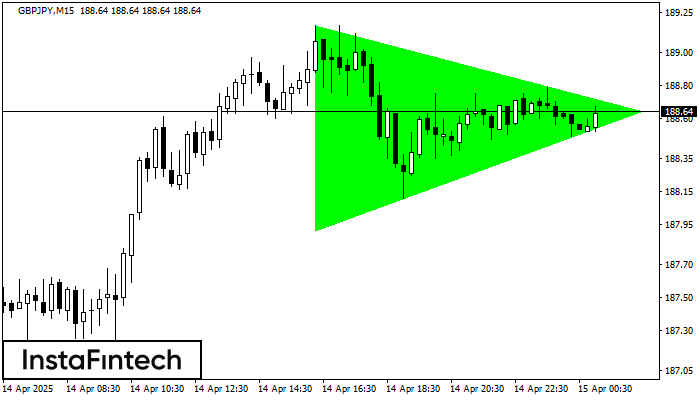
According to the chart of M15, GBPJPY formed the Bullish Symmetrical Triangle pattern. The lower border of the pattern touches the coordinates 187.91/188.64 whereas the upper border goes across 189.17/188.64. If the Bullish Symmetrical Triangle pattern is in progress, this evidently signals a further upward trend. In other words, in case the scenario comes true, the price of GBPJPY will breach the upper border to head for 188.87.
The M5 and M15 time frames may have more false entry points.
ดูเพิ่มเติม
- All
- All
- Bearish Rectangle
- Bearish Symmetrical Triangle
- Bearish Symmetrical Triangle
- Bullish Rectangle
- Double Top
- Double Top
- Triple Bottom
- Triple Bottom
- Triple Top
- Triple Top
- All
- All
- Buy
- Sale
- All
- 1
- 2
- 3
- 4
- 5
รูปแบบกราฟจุดสองยอดขาลง (Double Bottom)
was formed on 22.04 at 23:05:56 (UTC+0)
signal strength 1 of 5
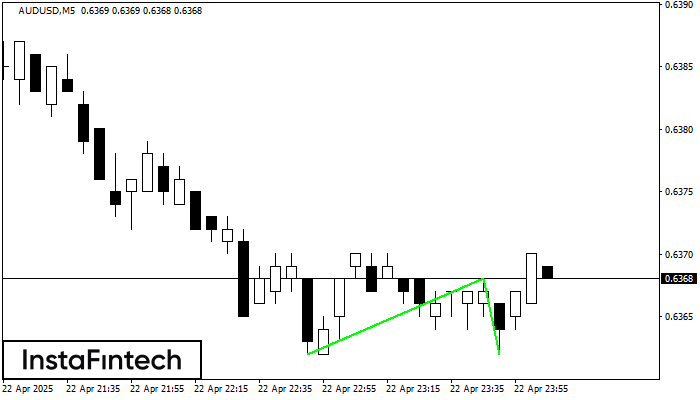
รูปแบบ รูปแบบกราฟจุดสองยอดขาลง (Double Bottom) ถูกสร้างขึ้นมาใน AUDUSD M5; ขอบเขตด้านบนอยู่ที่ 0.6368;ขอบเขตด้านล่าง คือ 0.6362 ความกว้างของรูปแบบนี้คือ 6 จุด กรณีที่มีการเคลื่อนตัวทะลุผ่านขอบเขตด้านบน
ขอบเตระยะเวลาใน M5 และ M15 อาจจะมีตำแหน่งการเข้าใช้งานที่ผิดพลาดมากยิ่งขึ้น
Open chart in a new window
รูปแบบกราฟธงปลายแหลมขาขึ้น (Bullish pennant)
was formed on 22.04 at 23:00:37 (UTC+0)
signal strength 2 of 5
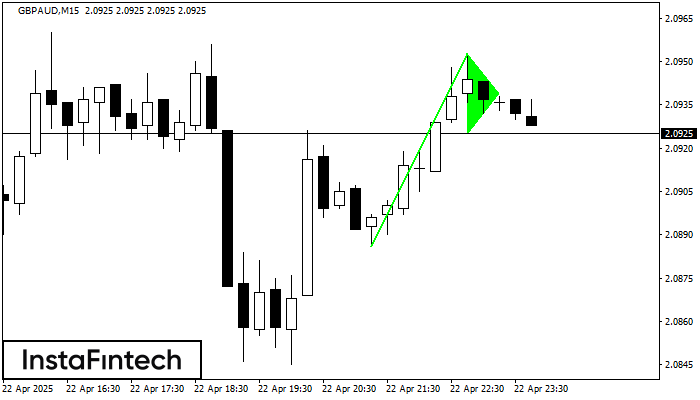
สัญญาณ รูปแบบกราฟธงปลายแหลมขาขึ้น (Bullish pennant) – ตราสารการซื้อขาย GBPAUD M15 เป็นรูปแบบความต่อเนื่อง การคาดการณ์: มันเป็นไปได้ที่จะกำหนดสถานะแบบซื้อ ไว้สูงกว่าระดับสูงสุดของกราฟรูปแบบนี้ใน 2.0953 พร้อมกับแนวโน้มที่อาจจะมีการเคลื่อนตัวครั้งต่อไปที่จะกลายมาเป็นระดับสูงของเสาธง
ขอบเตระยะเวลาใน M5 และ M15 อาจจะมีตำแหน่งการเข้าใช้งานที่ผิดพลาดมากยิ่งขึ้น
Open chart in a new window
รูปแบบกราฟสี่เหลี่ยมผืนผ้าขาขึ้น (Bullish Rectangle)
was formed on 22.04 at 22:14:12 (UTC+0)
signal strength 1 of 5

อ้างอิงจากชาร์ตของ M5, GBPCHF ที่ได้สร้างรูปแบบ รูปแบบกราฟสี่เหลี่ยมผืนผ้าขาขึ้น (Bullish Rectangle) ออกมา ซึ่งเป็นรูปแบบของความต่อเนื่องในแนวโน้ม รูปแบบนี้จะอยู่ในขอบเขตตามนี้: ขอบเขตด้านล่าง 1.0906 – 1.0906
ขอบเตระยะเวลาใน M5 และ M15 อาจจะมีตำแหน่งการเข้าใช้งานที่ผิดพลาดมากยิ่งขึ้น
Open chart in a new window


