

รูปแบบกราฟ

รูปแบบกราฟนั้นเป็น รูปจำลองทางกราฟฟิกที่ถูกสร้างขึ้นมาในชาร์ตจากราคา อ้างอิงตามหนึ่งในการวิเคราะห์ทางเทคนิค ที่ตั้งสมมติฐานมาว่า ประวัติศาสตร์ (การเคลื่อนไหวของราคา) มักจะเกิดขึ้นซ้ำรอยเดิม นั้นหมายความว่า การเคลื่อนไหวของราคาก็หมือนกับ สถานการณ์หนึ่งที่จะสามารถทำการคาดการณ์ไปยังทิศทางในอนาคต ตามเหตุการณ์ที่น่าจะมีความเป็นไปได้สูง
รูปแบบกราฟที่สำคัญจากทาง InstaTrade นั้นจะเป็นการบริการที่มีการใช้อย่างง่ายดาย ซึ่งจะช่วยให้คุณสามารถทราบถึงการเปลี่ยนแปลงล่าสุด ในตลาดได้ และสามารถรับมือกับข้อมูลจากทางตลาดได้ทันท่วงที ในการบริการของพวกเรานั้น คุณจะพบกับรูปแบบกราฟล่าสุดและมีความสำคัญมากที่สุดในทุกๆคู่สกุลเงิน และทุกๆขอบเขตเวลา
Bearish Rectangle
was formed on 14.04 at 16:42:50 (UTC+0)
signal strength 1 of 5
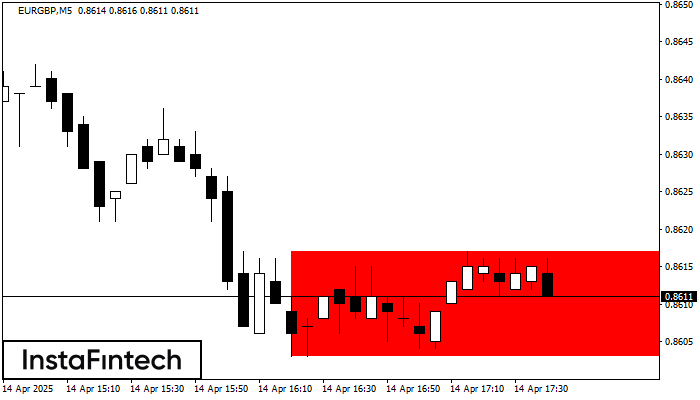
According to the chart of M5, EURGBP formed the Bearish Rectangle. The pattern indicates a trend continuation. The upper border is 0.8617, the lower border is 0.8603. The signal means that a short position should be opened after fixing a price below the lower border 0.8603 of the Bearish Rectangle.
The M5 and M15 time frames may have more false entry points.
- All
- All
- Bearish Rectangle
- Bearish Symmetrical Triangle
- Bearish Symmetrical Triangle
- Bullish Rectangle
- Double Top
- Double Top
- Triple Bottom
- Triple Bottom
- Triple Top
- Triple Top
- All
- All
- Buy
- Sale
- All
- 1
- 2
- 3
- 4
- 5
Retângulo de baixa
was formed on 15.05 at 06:55:13 (UTC+0)
signal strength 1 of 5

De acordo com o gráfico de M5, GBPJPY formou Retângulo de baixa. Este tipo de padrão indica uma continuação da tendência. Ele consiste em dois níveis: resistência 194.04 – 0.00
Os intervalos M5 e M15 podem ter mais pontos de entrada falsos.
Open chart in a new window
Retângulo de baixa
was formed on 15.05 at 06:36:51 (UTC+0)
signal strength 1 of 5
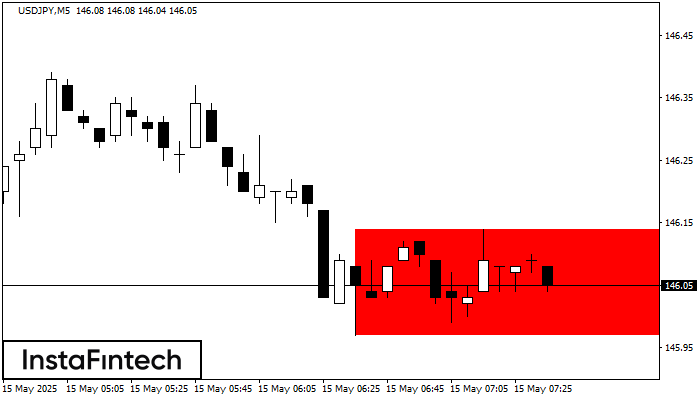
De acordo com o gráfico de M5, USDJPY formou Retângulo de baixa. O padrão indica uma continuação da tendência. O limite superior é 146.14, o limite inferior é 145.97
Os intervalos M5 e M15 podem ter mais pontos de entrada falsos.
Open chart in a new window
Pennant de baixa
was formed on 15.05 at 06:03:56 (UTC+0)
signal strength 2 of 5

O padrão Pennant de baixa foi formado no gráfico USDJPY M15. Este tipo de padrão é caracterizado por uma ligeira desaceleração após a qual o preço se moverá na direção
Os intervalos M5 e M15 podem ter mais pontos de entrada falsos.
Open chart in a new window

