

รูปแบบกราฟ

รูปแบบกราฟนั้นเป็น รูปจำลองทางกราฟฟิกที่ถูกสร้างขึ้นมาในชาร์ตจากราคา อ้างอิงตามหนึ่งในการวิเคราะห์ทางเทคนิค ที่ตั้งสมมติฐานมาว่า ประวัติศาสตร์ (การเคลื่อนไหวของราคา) มักจะเกิดขึ้นซ้ำรอยเดิม นั้นหมายความว่า การเคลื่อนไหวของราคาก็หมือนกับ สถานการณ์หนึ่งที่จะสามารถทำการคาดการณ์ไปยังทิศทางในอนาคต ตามเหตุการณ์ที่น่าจะมีความเป็นไปได้สูง
รูปแบบกราฟที่สำคัญจากทาง InstaTrade นั้นจะเป็นการบริการที่มีการใช้อย่างง่ายดาย ซึ่งจะช่วยให้คุณสามารถทราบถึงการเปลี่ยนแปลงล่าสุด ในตลาดได้ และสามารถรับมือกับข้อมูลจากทางตลาดได้ทันท่วงที ในการบริการของพวกเรานั้น คุณจะพบกับรูปแบบกราฟล่าสุดและมีความสำคัญมากที่สุดในทุกๆคู่สกุลเงิน และทุกๆขอบเขตเวลา
Triple Bottom
was formed on 07.04 at 02:30:15 (UTC+0)
signal strength 1 of 5
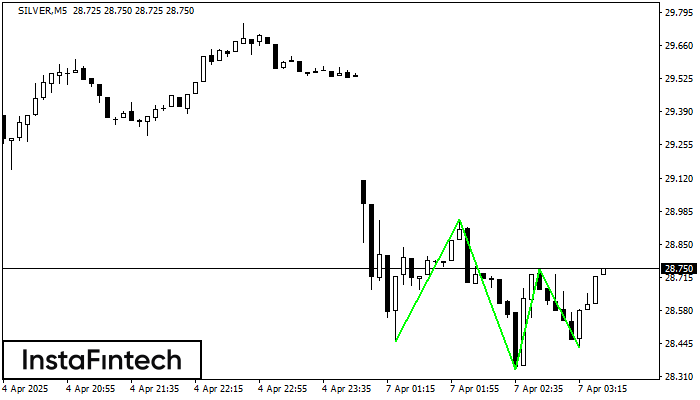
The Triple Bottom pattern has formed on the chart of SILVER M5. Features of the pattern: The lower line of the pattern has coordinates 28.95 with the upper limit 28.95/28.75, the projection of the width is 495 points. The formation of the Triple Bottom pattern most likely indicates a change in the trend from downward to upward. This means that in the event of a breakdown of the resistance level 28.45, the price is most likely to continue the upward movement.
The M5 and M15 time frames may have more false entry points.
ดูเพิ่มเติม
- All
- All
- Bearish Rectangle
- Bearish Symmetrical Triangle
- Bearish Symmetrical Triangle
- Bullish Rectangle
- Double Top
- Double Top
- Triple Bottom
- Triple Bottom
- Triple Top
- Triple Top
- All
- All
- Buy
- Sale
- All
- 1
- 2
- 3
- 4
- 5
รูปแบบสามเหลี่ยมสมมาตรขาขึ้น (Bullish Symmetrical Triangle)
was formed on 22.04 at 00:32:37 (UTC+0)
signal strength 1 of 5

อ้างอิงจากชาร์ตของ M5, GBPAUD ที่ได้สร้างรูปแบบ รูปแบบสามเหลี่ยมสมมาตรขาขึ้น (Bullish Symmetrical Triangle) ออกมา ขอบเขตด้านล่างของรูปแบบสัมผัสพิกัด 2.0825/2.0852 แม้ว่าขอบเขตด้านบนจะข้ามผ่าน 2.0880/2.0852 ถ้ารูปแบบ รูปแบบสามเหลี่ยมสมมาตรขาขึ้น
ขอบเตระยะเวลาใน M5 และ M15 อาจจะมีตำแหน่งการเข้าใช้งานที่ผิดพลาดมากยิ่งขึ้น
Open chart in a new window
รูปแบบสามเหลี่ยมสมมาตรขาขึ้น (Bullish Symmetrical Triangle)
was formed on 22.04 at 00:30:42 (UTC+0)
signal strength 1 of 5

อ้างอิงจากชาร์ตของ M5, AUDCAD ที่ได้สร้างรูปแบบ รูปแบบสามเหลี่ยมสมมาตรขาขึ้น (Bullish Symmetrical Triangle) ออกมา คำอธิบาย: นี้คือรูปแบบของความต่อเนื่องในแนวโน้ม 0.8879 และ 0.8869 เป็นพิกัดของขอบเขตด้านบนและด้านล่าง
ขอบเตระยะเวลาใน M5 และ M15 อาจจะมีตำแหน่งการเข้าใช้งานที่ผิดพลาดมากยิ่งขึ้น
Open chart in a new window
รูปแบบสามเหลี่ยมสมมาตรขาลง (Bearish Symmetrical Triangle)
was formed on 22.04 at 00:27:05 (UTC+0)
signal strength 3 of 5

อ้างอิงจากชาร์ตของ M30, USDJPY ที่ได้สร้างรูปแบบ รูปแบบสามเหลี่ยมสมมาตรขาลง (Bearish Symmetrical Triangle) ออกมา รูปแบบนี้แสดงถึงแนวโน้มขาลงที่เกิดขึ้นต่อไป ในกรณีที่ขอบเขตด้านล่าง 140.49 จะมีการเคลื่อนตัวทะลุผ่าน2f ส่วนนี้ เป็นผลกำไรที่คาดการณ์ไว้
Open chart in a new window


