

รูปแบบกราฟ

รูปแบบกราฟนั้นเป็น รูปจำลองทางกราฟฟิกที่ถูกสร้างขึ้นมาในชาร์ตจากราคา อ้างอิงตามหนึ่งในการวิเคราะห์ทางเทคนิค ที่ตั้งสมมติฐานมาว่า ประวัติศาสตร์ (การเคลื่อนไหวของราคา) มักจะเกิดขึ้นซ้ำรอยเดิม นั้นหมายความว่า การเคลื่อนไหวของราคาก็หมือนกับ สถานการณ์หนึ่งที่จะสามารถทำการคาดการณ์ไปยังทิศทางในอนาคต ตามเหตุการณ์ที่น่าจะมีความเป็นไปได้สูง
รูปแบบกราฟที่สำคัญจากทาง InstaTrade นั้นจะเป็นการบริการที่มีการใช้อย่างง่ายดาย ซึ่งจะช่วยให้คุณสามารถทราบถึงการเปลี่ยนแปลงล่าสุด ในตลาดได้ และสามารถรับมือกับข้อมูลจากทางตลาดได้ทันท่วงที ในการบริการของพวกเรานั้น คุณจะพบกับรูปแบบกราฟล่าสุดและมีความสำคัญมากที่สุดในทุกๆคู่สกุลเงิน และทุกๆขอบเขตเวลา
Double Bottom
was formed on 04.04 at 10:35:13 (UTC+0)
signal strength 1 of 5
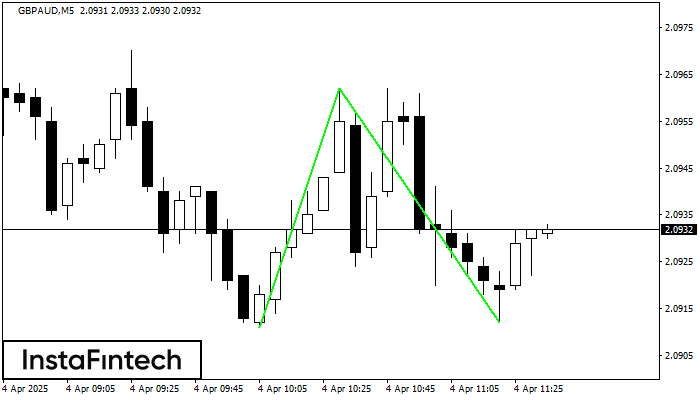
The Double Bottom pattern has been formed on GBPAUD M5; the upper boundary is 2.0962; the lower boundary is 2.0912. The width of the pattern is 51 points. In case of a break of the upper boundary 2.0962, a change in the trend can be predicted where the width of the pattern will coincide with the distance to a possible take profit level.
The M5 and M15 time frames may have more false entry points.
- All
- All
- Bearish Rectangle
- Bearish Symmetrical Triangle
- Bearish Symmetrical Triangle
- Bullish Rectangle
- Double Top
- Double Top
- Triple Bottom
- Triple Bottom
- Triple Top
- Triple Top
- All
- All
- Buy
- Sale
- All
- 1
- 2
- 3
- 4
- 5
รูปแบบกราฟหัวและหัวไหล่ (Head and Shoulders)
was formed on 13.05 at 10:55:14 (UTC+0)
signal strength 1 of 5

SILVER M5 ได้สร้างรูปแบบ รูปแบบกราฟหัวและหัวไหล่ (Head and Shoulders) พร้อมกับคุณลักษณะดังต่อไปนี้ : ระดับสูงของตำแหน่งหัวอยู่ที่ 33.17, ตำแหน่งคอ และมุมขาขึ้นอยู่ที่ 33.07/33.08 การก่อตัวของรูปแบบเช่นนี้
ขอบเตระยะเวลาใน M5 และ M15 อาจจะมีตำแหน่งการเข้าใช้งานที่ผิดพลาดมากยิ่งขึ้น
Open chart in a new window
รูปแบบกราฟจุดสองยอด (Double Top)
was formed on 13.05 at 10:25:03 (UTC+0)
signal strength 1 of 5
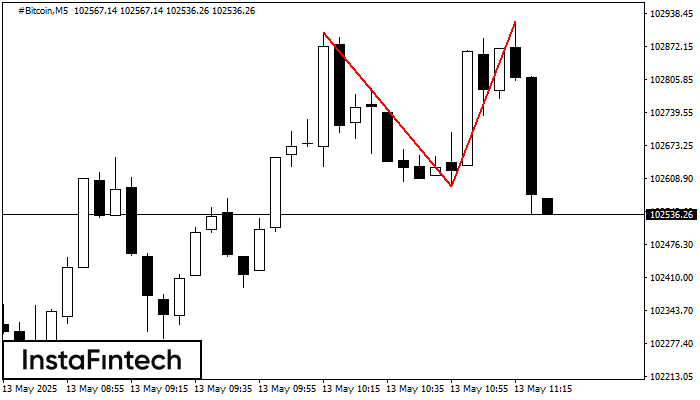
ในชาร์ตของ #Bitcoin M5 พบว่า กราฟรูปแบบย้อนกลับ รูปแบบกราฟจุดสองยอด (Double Top) ได้ถูกสร้างขึ้นมา คุณลักษณะ: ขอบเขตด้านบน 102921.94; ขอบเขตด้านล่าง 102591.19; ความกว้างของกราฟรูปแบบนี้คือ
ขอบเตระยะเวลาใน M5 และ M15 อาจจะมีตำแหน่งการเข้าใช้งานที่ผิดพลาดมากยิ่งขึ้น
Open chart in a new window
รูปแบบกราฟจุดสามยอดขาลง (Triple Bottom)
was formed on 13.05 at 09:59:46 (UTC+0)
signal strength 4 of 5
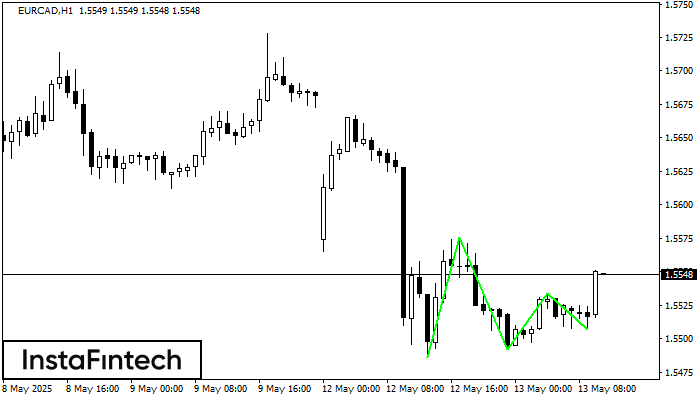
รูปแบบ รูปแบบกราฟจุดสามยอดขาลง (Triple Bottom) ได้ถูกสร้างขึ้นมาใน EURCAD H1 มันมี คุณลักษณะ ดังต่อไปนี้: ระดับแนวต้าน 1.5576/1.5534; ระดับของแนวรับ 1.5486/1.5507; ความกว้างคือ
Open chart in a new window


