

รูปแบบกราฟ

รูปแบบกราฟนั้นเป็น รูปจำลองทางกราฟฟิกที่ถูกสร้างขึ้นมาในชาร์ตจากราคา อ้างอิงตามหนึ่งในการวิเคราะห์ทางเทคนิค ที่ตั้งสมมติฐานมาว่า ประวัติศาสตร์ (การเคลื่อนไหวของราคา) มักจะเกิดขึ้นซ้ำรอยเดิม นั้นหมายความว่า การเคลื่อนไหวของราคาก็หมือนกับ สถานการณ์หนึ่งที่จะสามารถทำการคาดการณ์ไปยังทิศทางในอนาคต ตามเหตุการณ์ที่น่าจะมีความเป็นไปได้สูง
รูปแบบกราฟที่สำคัญจากทาง InstaTrade นั้นจะเป็นการบริการที่มีการใช้อย่างง่ายดาย ซึ่งจะช่วยให้คุณสามารถทราบถึงการเปลี่ยนแปลงล่าสุด ในตลาดได้ และสามารถรับมือกับข้อมูลจากทางตลาดได้ทันท่วงที ในการบริการของพวกเรานั้น คุณจะพบกับรูปแบบกราฟล่าสุดและมีความสำคัญมากที่สุดในทุกๆคู่สกุลเงิน และทุกๆขอบเขตเวลา
Bearish pennant
was formed on 03.04 at 19:27:15 (UTC+0)
signal strength 1 of 5
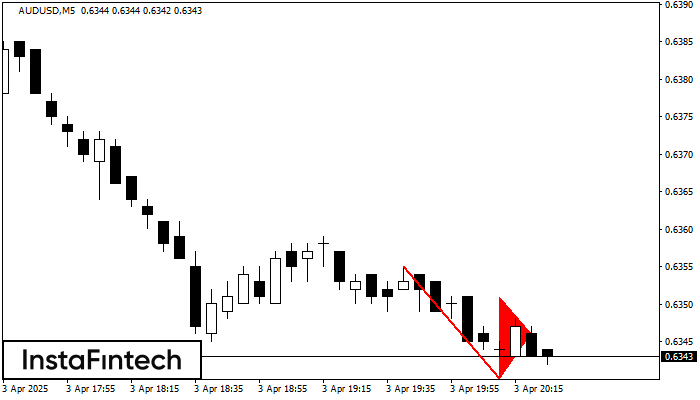
The Bearish pennant pattern has formed on the AUDUSD M5 chart. The pattern signals continuation of the downtrend in case the pennant’s low of 0.6340 is broken through. Recommendations: Place the sell stop pending order 10 pips below the pattern’s low. Place the take profit order at the projection distance of the flagpole height.
The M5 and M15 time frames may have more false entry points.
- All
- All
- Bearish Rectangle
- Bearish Symmetrical Triangle
- Bearish Symmetrical Triangle
- Bullish Rectangle
- Double Top
- Double Top
- Triple Bottom
- Triple Bottom
- Triple Top
- Triple Top
- All
- All
- Buy
- Sale
- All
- 1
- 2
- 3
- 4
- 5
Double Bottom
сформирован 15.05 в 03:40:41 (UTC+0)
сила сигнала 1 из 5
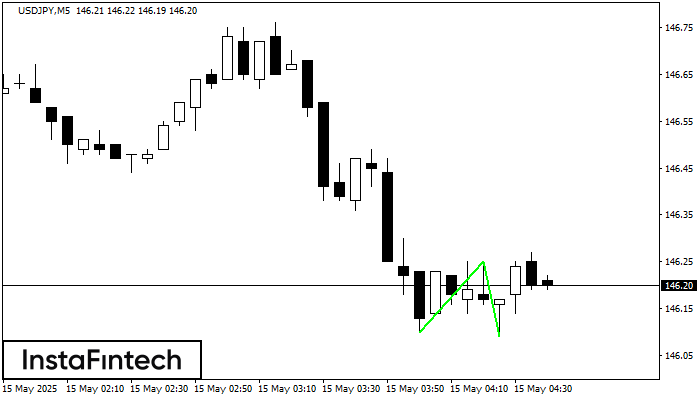
The Double Bottom pattern has been formed on USDJPY M5; the upper boundary is 146.25; the lower boundary is 146.09. The width of the pattern is 15 points. In case
The M5 and M15 time frames may have more false entry points.
Открыть график инструмента в новом окне
Double Bottom
сформирован 15.05 в 03:35:27 (UTC+0)
сила сигнала 1 из 5
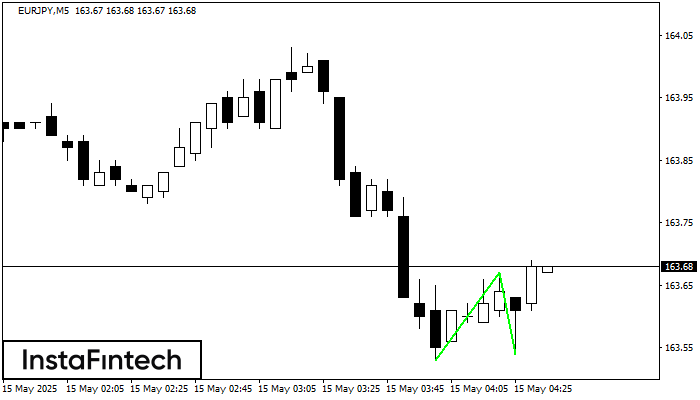
The Double Bottom pattern has been formed on EURJPY M5; the upper boundary is 163.67; the lower boundary is 163.54. The width of the pattern is 14 points. In case
The M5 and M15 time frames may have more false entry points.
Открыть график инструмента в новом окне
Triple Bottom
сформирован 15.05 в 03:00:19 (UTC+0)
сила сигнала 3 из 5
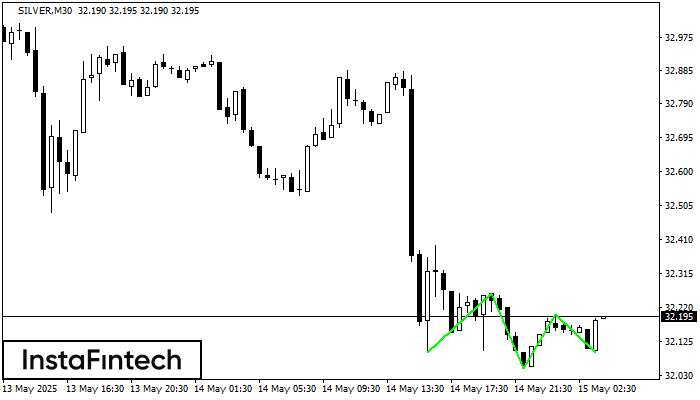
The Triple Bottom pattern has formed on the chart of the SILVER M30 trading instrument. The pattern signals a change in the trend from downwards to upwards in the case
Открыть график инструмента в новом окне


