

รูปแบบกราฟ

รูปแบบกราฟนั้นเป็น รูปจำลองทางกราฟฟิกที่ถูกสร้างขึ้นมาในชาร์ตจากราคา อ้างอิงตามหนึ่งในการวิเคราะห์ทางเทคนิค ที่ตั้งสมมติฐานมาว่า ประวัติศาสตร์ (การเคลื่อนไหวของราคา) มักจะเกิดขึ้นซ้ำรอยเดิม นั้นหมายความว่า การเคลื่อนไหวของราคาก็หมือนกับ สถานการณ์หนึ่งที่จะสามารถทำการคาดการณ์ไปยังทิศทางในอนาคต ตามเหตุการณ์ที่น่าจะมีความเป็นไปได้สูง
รูปแบบกราฟที่สำคัญจากทาง InstaTrade นั้นจะเป็นการบริการที่มีการใช้อย่างง่ายดาย ซึ่งจะช่วยให้คุณสามารถทราบถึงการเปลี่ยนแปลงล่าสุด ในตลาดได้ และสามารถรับมือกับข้อมูลจากทางตลาดได้ทันท่วงที ในการบริการของพวกเรานั้น คุณจะพบกับรูปแบบกราฟล่าสุดและมีความสำคัญมากที่สุดในทุกๆคู่สกุลเงิน และทุกๆขอบเขตเวลา
Double Bottom
was formed on 02.04 at 11:20:53 (UTC+0)
signal strength 1 of 5

The Double Bottom pattern has been formed on EURNZD M5. Characteristics: the support level 1.8799; the resistance level 1.8817; the width of the pattern 18 points. If the resistance level is broken, a change in the trend can be predicted with the first target point lying at the distance of 17 points.
The M5 and M15 time frames may have more false entry points.
- All
- All
- Bearish Rectangle
- Bearish Symmetrical Triangle
- Bearish Symmetrical Triangle
- Bullish Rectangle
- Double Top
- Double Top
- Triple Bottom
- Triple Bottom
- Triple Top
- Triple Top
- All
- All
- Buy
- Sale
- All
- 1
- 2
- 3
- 4
- 5
รูปแบบกราฟจุดสองยอดขาลง (Double Bottom)
was formed on 22.04 at 12:20:21 (UTC+0)
signal strength 1 of 5

รูปแบบ รูปแบบกราฟจุดสองยอดขาลง (Double Bottom) ถูกสร้างขึ้นมาใน AUDCHF M5 การก่อตัวเช่นนี้แสดงถึงการย้อนตัวของแนวโน้มจากด้านล่าง ขึ้นมายังด้านบน สัญญาณแสดงให้เห็นถึง การเทรดแบบการซื้อที่ควรเปิด หลังจากที่มีการเคลื่อนตัวทะลุผ่านขอบเขตด้านบนของรูปแบบ 0.5194 การเคลื่อนไหวต่อจากนั้นจะอยู่ในความกว้างของรูปแบบปัจจุบัน
ขอบเตระยะเวลาใน M5 และ M15 อาจจะมีตำแหน่งการเข้าใช้งานที่ผิดพลาดมากยิ่งขึ้น
Open chart in a new window
รูปแบบกราฟสี่เหลี่ยมผืนผ้าขาลง (Bearish Rectangle)
was formed on 22.04 at 12:07:02 (UTC+0)
signal strength 3 of 5
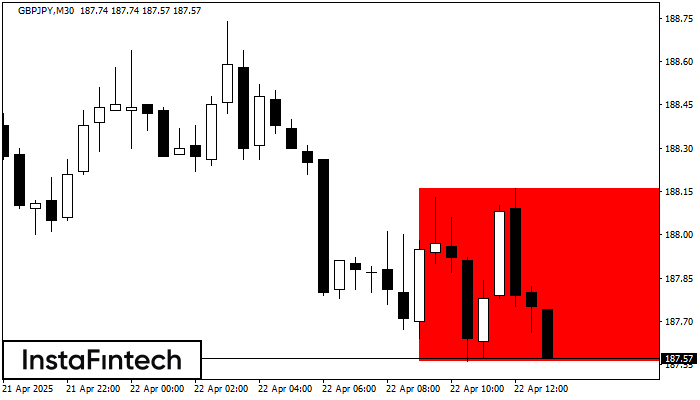
อ้างอิงจากชาร์ตของ M30, GBPJPY ที่ได้สร้างรูปแบบ รูปแบบกราฟสี่เหลี่ยมผืนผ้าขาลง (Bearish Rectangle) ออกมา ซึ่งเป็นรูปแบบของ ความต่อเนื่องในแนวโน้ม รูปแบบนี้จะอยู่ภายในขอบเขตดังต่อไปนี้: ขอบเขตด้านล่าง 187.56 – 187.56
Open chart in a new window
รูปแบบกราฟสี่เหลี่ยมผืนผ้าขาลง (Bearish Rectangle)
was formed on 22.04 at 12:07:00 (UTC+0)
signal strength 2 of 5
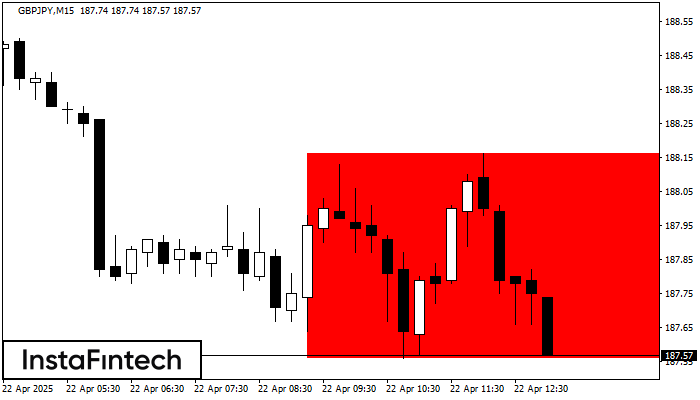
อ้างอิงจากชาร์ตของ M15, GBPJPY ที่ได้สร้างรูปแบบ รูปแบบกราฟสี่เหลี่ยมผืนผ้าขาลง (Bearish Rectangle) ออกมา ซึ่งเป็นรูปแบบของ ความต่อเนื่องในแนวโน้ม รูปแบบนี้จะอยู่ภายในขอบเขตดังต่อไปนี้: ขอบเขตด้านล่าง 187.56 – 187.56
ขอบเตระยะเวลาใน M5 และ M15 อาจจะมีตำแหน่งการเข้าใช้งานที่ผิดพลาดมากยิ่งขึ้น
Open chart in a new window


