

รูปแบบกราฟ

รูปแบบกราฟนั้นเป็น รูปจำลองทางกราฟฟิกที่ถูกสร้างขึ้นมาในชาร์ตจากราคา อ้างอิงตามหนึ่งในการวิเคราะห์ทางเทคนิค ที่ตั้งสมมติฐานมาว่า ประวัติศาสตร์ (การเคลื่อนไหวของราคา) มักจะเกิดขึ้นซ้ำรอยเดิม นั้นหมายความว่า การเคลื่อนไหวของราคาก็หมือนกับ สถานการณ์หนึ่งที่จะสามารถทำการคาดการณ์ไปยังทิศทางในอนาคต ตามเหตุการณ์ที่น่าจะมีความเป็นไปได้สูง
รูปแบบกราฟที่สำคัญจากทาง InstaTrade นั้นจะเป็นการบริการที่มีการใช้อย่างง่ายดาย ซึ่งจะช่วยให้คุณสามารถทราบถึงการเปลี่ยนแปลงล่าสุด ในตลาดได้ และสามารถรับมือกับข้อมูลจากทางตลาดได้ทันท่วงที ในการบริการของพวกเรานั้น คุณจะพบกับรูปแบบกราฟล่าสุดและมีความสำคัญมากที่สุดในทุกๆคู่สกุลเงิน และทุกๆขอบเขตเวลา
Bearish pennant
was formed on 31.03 at 01:15:38 (UTC+0)
signal strength 2 of 5

The Bearish pennant pattern has formed on the AUDUSD M15 chart. It signals potential continuation of the existing trend. Specifications: the pattern’s bottom has the coordinate of 0.6272; the projection of the flagpole height is equal to 19 pips. In case the price breaks out the pattern’s bottom of 0.6272, the downtrend is expected to continue for further level 0.6249.
The M5 and M15 time frames may have more false entry points.
ดูเพิ่มเติม
- All
- All
- Bearish Rectangle
- Bearish Symmetrical Triangle
- Bearish Symmetrical Triangle
- Bullish Rectangle
- Double Top
- Double Top
- Triple Bottom
- Triple Bottom
- Triple Top
- Triple Top
- All
- All
- Buy
- Sale
- All
- 1
- 2
- 3
- 4
- 5
รูปแบบกราฟจุดสองยอด (Double Top)
was formed on 25.04 at 11:40:02 (UTC+0)
signal strength 1 of 5
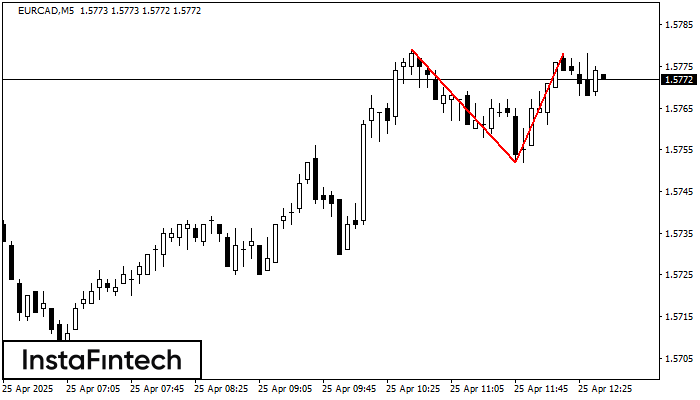
ในชาร์ตของ EURCAD M5 พบว่า กราฟรูปแบบย้อนกลับ รูปแบบกราฟจุดสองยอด (Double Top) ได้ถูกสร้างขึ้นมา คุณลักษณะ: ขอบเขตด้านบน 1.5778; ขอบเขตด้านล่าง 1.5752; ความกว้างของกราฟรูปแบบนี้คือ
ขอบเตระยะเวลาใน M5 และ M15 อาจจะมีตำแหน่งการเข้าใช้งานที่ผิดพลาดมากยิ่งขึ้น
Open chart in a new window
รูปแบบกราฟจุดสามยอดขาลง (Triple Bottom)
was formed on 25.04 at 11:34:47 (UTC+0)
signal strength 1 of 5
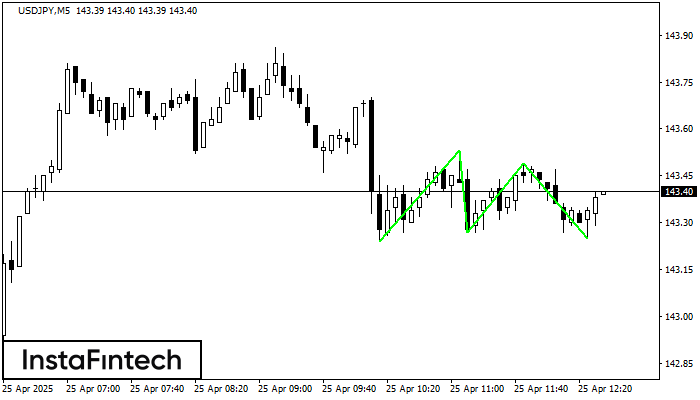
รูปแบบ รูปแบบกราฟจุดสามยอดขาลง (Triple Bottom) ได้ถูกสร้างขึ้นมาใน USDJPY M5 มันมี คุณลักษณะ ดังต่อไปนี้: ระดับแนวต้าน 143.53/143.49; ระดับของแนวรับ 143.24/143.25; ความกว้างคือ
ขอบเตระยะเวลาใน M5 และ M15 อาจจะมีตำแหน่งการเข้าใช้งานที่ผิดพลาดมากยิ่งขึ้น
Open chart in a new window
รูปแบบกราฟหัวและหัวไหล่ (Head and Shoulders)
was formed on 25.04 at 11:16:23 (UTC+0)
signal strength 2 of 5

รูปแบบทางเทคนิค ทำให้เกิด รูปแบบกราฟหัวและหัวไหล่ (Head and Shoulders) ที่ปรากฎออกมาในชาร์ตของ USDCHF M15 มีเหตุผลที่หนักแน่นอยู่หลายประการที่แสดงให้เห็นว่า ราคาจะมุ่งหน้าผ่านตำแหน่งส่วนคอ 0.8293/0.8295 หลังจากตำแหน่งส่วนหัวไหล่ด้านขวาได้ถูกสร้างขึ้นมา ดังนั้นแนวโน้มจะมีการเปลี่ยนแปลงพร้อมกับราคาที่จะมุ่งหน้าไปยัง0.8273
ขอบเตระยะเวลาใน M5 และ M15 อาจจะมีตำแหน่งการเข้าใช้งานที่ผิดพลาดมากยิ่งขึ้น
Open chart in a new window


