

รูปแบบกราฟ

รูปแบบกราฟนั้นเป็น รูปจำลองทางกราฟฟิกที่ถูกสร้างขึ้นมาในชาร์ตจากราคา อ้างอิงตามหนึ่งในการวิเคราะห์ทางเทคนิค ที่ตั้งสมมติฐานมาว่า ประวัติศาสตร์ (การเคลื่อนไหวของราคา) มักจะเกิดขึ้นซ้ำรอยเดิม นั้นหมายความว่า การเคลื่อนไหวของราคาก็หมือนกับ สถานการณ์หนึ่งที่จะสามารถทำการคาดการณ์ไปยังทิศทางในอนาคต ตามเหตุการณ์ที่น่าจะมีความเป็นไปได้สูง
รูปแบบกราฟที่สำคัญจากทาง InstaTrade นั้นจะเป็นการบริการที่มีการใช้อย่างง่ายดาย ซึ่งจะช่วยให้คุณสามารถทราบถึงการเปลี่ยนแปลงล่าสุด ในตลาดได้ และสามารถรับมือกับข้อมูลจากทางตลาดได้ทันท่วงที ในการบริการของพวกเรานั้น คุณจะพบกับรูปแบบกราฟล่าสุดและมีความสำคัญมากที่สุดในทุกๆคู่สกุลเงิน และทุกๆขอบเขตเวลา
Bearish Symmetrical Triangle
was formed on 27.03 at 03:36:20 (UTC+0)
signal strength 2 of 5
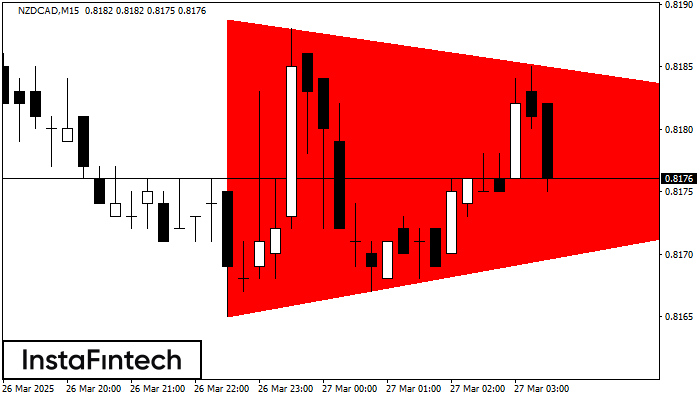
According to the chart of M15, NZDCAD formed the Bearish Symmetrical Triangle pattern. Trading recommendations: A breach of the lower border 0.8165 is likely to encourage a continuation of the downward trend.
The M5 and M15 time frames may have more false entry points.
- All
- All
- Bearish Rectangle
- Bearish Symmetrical Triangle
- Bearish Symmetrical Triangle
- Bullish Rectangle
- Double Top
- Double Top
- Triple Bottom
- Triple Bottom
- Triple Top
- Triple Top
- All
- All
- Buy
- Sale
- All
- 1
- 2
- 3
- 4
- 5
Double Top
was formed on 13.05 at 00:00:08 (UTC+0)
signal strength 4 of 5
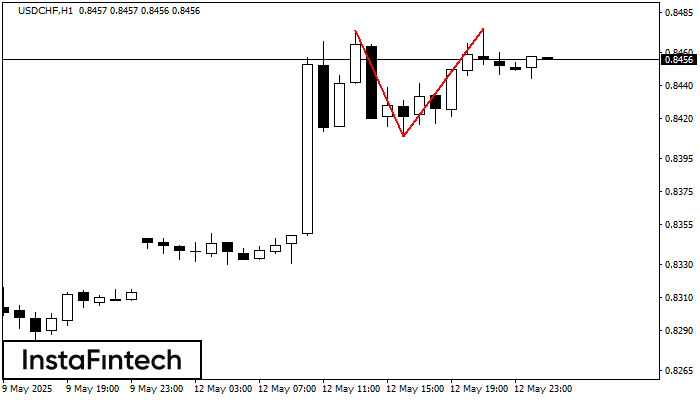
Corak pembalikan Double Top telah dibentuk pada USDCHF H1. Ciri-ciri: sempadan atas %P0.000000; sempadan bawah 0.8474; sempadan bawah 0.8409; lebar corak adalah 66 mata. Dagangan menjual adalah lebih baik untuk
Open chart in a new window
Double Bottom
was formed on 12.05 at 23:15:09 (UTC+0)
signal strength 1 of 5
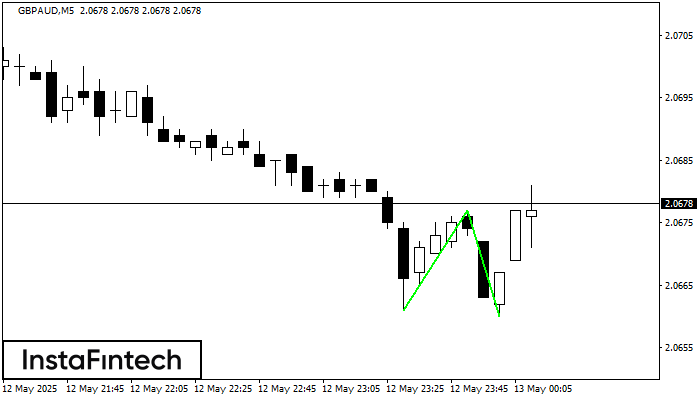
Corak Double Bottom telah dibentuk pada GBPAUD M5; sempadan atas adalah 2.0677; sempadan bawah adalah 2.0660. Lebar corak adalah 16 mata. Sekiranya penembusan sempadan atas 2.0677, perubahan aliran boleh diramalkan
Carta masa M5 dan M15 mungkin mempunyai lebih banyak titik kemasukan palsu.
Open chart in a new window
Double Top
was formed on 12.05 at 22:00:17 (UTC+0)
signal strength 3 of 5
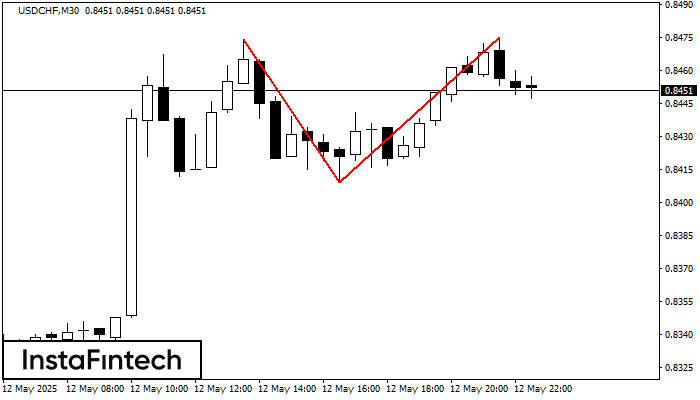
Pada carta USDCHF M30 corak pembalikan Double Top telah terbentuk. Ciri-ciri: sempadan atas 0.8475; sempadan bawah 0.8409; lebar corak 66 mata. Isyarat: penembusan sempadan bawah akan menyebabkan kesinambungan arah aliran
Open chart in a new window


