อ่านรายละเอียดเพิ่มเติม


 18.07.2022 10:35 AM
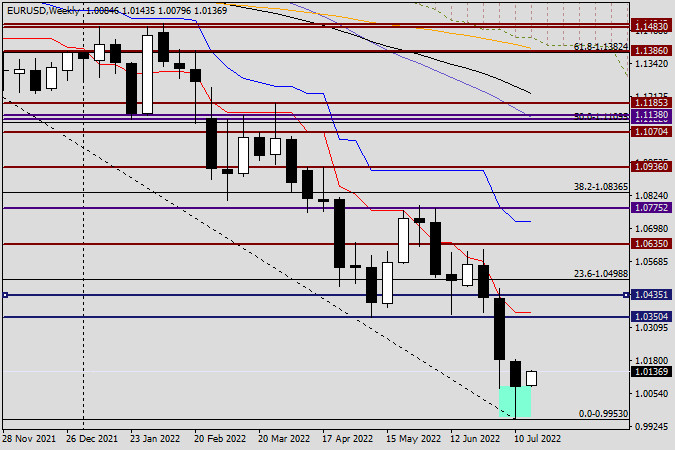
Consequently, during the 11–15 June auction, the EUR/USD currency pair maintained its downward trend, reaching a price of 0.9953. In a moment, we'll examine the technical picture of the primary currency pair in further detail; for now, we'll speak briefly about other data. This week, the European Central Bank will hold a meeting, after which a decision will be taken about interest rates. The mainstream expectation assumes that the ECB will raise the key interest rate by 25 basis points. However, will this be sufficient to convince the market of the decisiveness of tightening monetary policy to confront high inflation? It may be the fundamental question determining the future of the most important currency pair in the Forex market. According to the author's personal opinion, such a tardy and previously publicized hike in the key rate has already been factored into the price of the single European currency, and if that is the case, then support for the euro from this decision of the European Central Bank is unlikely. Nonetheless, the technical picture indicates a potential reversal of the euro/dollar, at least for a corrective drop. The EUR/USD weekly chart is studied.
Weekly
On the weekly timescale, a candle with a suitably long-emphasized lower shadow has been generated based on the trading activity of the previous five days. The fact that this candle arose after attempting to fall below the most significant psychological and historical threshold of 1.0000 is a defining aspect of its appearance. Now that so much has been written about the accomplishment of EUR/USD parity, it has finally captured the attention of market participants. Last week, the price closed at 1.0078 after bouncing off this key level. This week's trading begins at a time when euro bulls are attempting to continue reducing the previous large losses. Given the long lower shadow of the previous candle and the impending ECB rate hike, I believe the major currency pair has a chance of exhibiting an upward trend based on the outcomes of trading over the past five days.Nevertheless, a great deal will depend on the words of ECB leaders. If a clear signal is received regarding a further and more forceful tightening of monetary policy, the probability of a last weekly increase will unquestionably increase. Without ECB support, it is doubtful that the single European currency will require support. On a weekly price chart, the region between 1.0350 and 1.0370 appears to be the closest growth objective. If the bearish trend continues, the bears will retest the 0.9953 minimum value from the previous week for a potential breakdown.
Daily
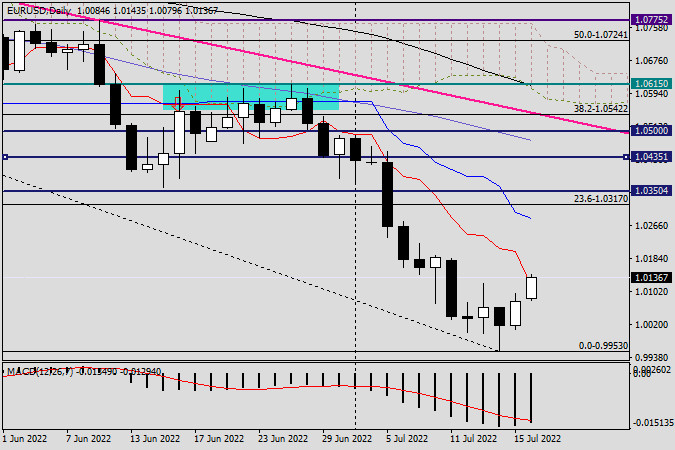
On the daily chart, the red Tenkan line of the Ichimoku indicator is being tested for a break higher during the current upward trend. If these efforts are successful, the pair may ascend to the blue Kijun line, which is located at 1.0284. I believe the capacity to climb the Kijun will play a significant role. Despite the negative trend in EUR/USD, I will not be shocked by the ensuing upward movement, which should still be deemed corrective. Tomorrow's article will examine smaller time intervals to identify favorable entry points for euro/dollar bets. Given the discussed timelines, I lean toward a positive scenario.
You have already liked this post today
*บทวิเคราะห์ในตลาดที่มีการโพสต์ตรงนี้ เพียงเพื่อทำให้คุณทราบถึงข้อมูล ไม่ได้เป็นการเจาะจงถึงขั้นตอนให้คุณทำการซื้อขายตาม
ในวันจันทร์ ค่า EUR/USD มีการซื้อขายในกรอบแคบ ๆ ระหว่างระดับ 1.1380 ถึง 1.1454 จึงสร้างกรอบราคาขึ้น ดังนั้น การดีดตัวจากพื้นที่สนับสนุนระหว่าง 1.1374–1.1380 จะช่วยเสริมแรงให้กับค่าเงินยูโรและการเติบโตต่อเนื่องไปยังระดับการปรับฐาน 76.4%
ในกราฟรายชั่วโมง คู่สกุลเงิน GBP/USD ในวันจันทร์เกิดการดีดตัวสองครั้งจากระดับการแก้ไข 161.8% ที่ 1.3520 แต่ไม่สามารถเริ่มการเคลื่อนไหวขึ้นได้ ในวันนี้ คือวันอังคาร คู่สกุลเงินได้ยืนยันการทรงตัวที่ต่ำกว่าระดับนี้ ซึ่งสามารถคาดหวังการลดลงทางต่อเนื่องไปยังระดับ 1.3425 และโซนสนับสนุนที่ 1.3344–1.3357
จากการปรากฏของรูปแบบ Ascending Broadening Wedge ซึ่งตามมาด้วยรูปแบบ Bearish 123 แสดงถึงแนวโน้มที่ EUR/USD อาจจะอ่อนค่าลงในอนาคตอันใกล้ โดยเฉพาะเมื่อได้รับการยืนยันจากการปรากฏของการแตกต่างระหว่างการเคลื่อนไหวของราคา EUR/USD และตัวชี้วัด CCI (30)
บนกราฟ 4 ชั่วโมงของคู่สกุลเงิน GBP/JPY สามารถสังเกตเห็นสิ่งที่น่าสนใจหลายประการ ประการแรก การเคลื่อนไหวของราคาอยู่เหนือ WMA (21) ซึ่งมีแนวโน้มเป็นขาขึ้น ประการที่สอง Stochastic Oscillator แสดงการ Convergence
วันจันทร์ที่ผ่านมาตลาดค่อนข้างสงบ และสิ่งที่เห็นเด่นชัดคือการฟื้นฟูความสัมพันธ์ที่เกี่ยวข้องกับความเสี่ยง ยูโรเด้งกลับจากเส้นแนวรับของ MACD รายวันสองวันติดต่อกันและเปิดวันนี้เหนือระดับแนวต้านที่ 1.1420 ตัวชี้วัด Marlin ยังคงขยับตัวขึ้นอย่างช้าๆ เป้าหมายที่ 1.1535 ยังคงเปิดอยู่ การรักษาระดับเหนือจุดนี้จะสามารถเปิดทางให้เกิดการเติบโตเพิ่มเติมไปยัง 1.1692 การรักษาระดับต่ำกว่าต่ำสุดของวันจันทร์ที่
ในวันจันทร์ ค่าเงินปอนด์อังกฤษปิดการซื้อขายด้วยการเพิ่มขึ้นเล็กน้อย รูปแบบนี้กลายเป็นเรื่องปกติในสัปดาห์ที่ผ่านมา—การเติบโตที่แสดงด้วยแท่งเทียนสีขาวขนาดเล็ก ในขณะที่การลดลงเกิดจากแท่งเทียนสีดำที่ยาวนาน แนวโน้มนี้จำเป็นต้องเปลี่ยนแปลง มิฉะนั้น ปอนด์อาจลดลง (ตามสถานการณ์ทางเลือก) ต่ำกว่าระดับสนับสนุนที่ 1.3433 และหากเกิดขึ้นจริง ก็จะไม่มีการสนับสนุนใดๆ เหลือจนถึงระดับ 1.3208 ออสซิลเลเตอร์
ค่าเงินดอลลาร์ออสเตรเลียได้แสดงการเติบโตในระดับปานกลางมากกว่าหนึ่งจุดในช่วง 10 วันที่ผ่านมา แต่การที่ Marlin oscillator ไม่เต็มใจที่จะเคลื่อนไหวตามการเพิ่มขึ้นนี้ กำลังสร้างความกังวลให้กับกลุ่มผู้ซื้อ เพื่อรักษาภาพรวมของสถานการณ์แนวโน้มขาขึ้น ราคาจะต้องรวมตัวอยู่เหนือเส้นด้านในของช่องราคาหรือเฉพาะเจาะจง คือเหนือระดับ 0.6548 นี่จะเป็นการคืนแนวโน้มการเติบโตไปสู่ 0.6650 หากราคาปรับตัวลงต่ำกว่าระดับ
ในช่วงเริ่มต้นของการซื้อขายในสหรัฐฯ ราคาทองคำซื้อขายอยู่ที่ประมาณ 3,317 โดยมีการฟื้นตัวหลังจากที่ราคาต่ำสุดอยู่ที่ 3,294 ในช่วงการซื้อขายในยุโรป บนกราฟ H4 ราคาทองคำอาจมีโอกาสที่จะเพิ่มขึ้นและอาจขึ้นไปถึง 21SMA ซึ่งอยู่ที่ประมาณ 3,449 แต่อย่างไรก็ตามยังมีแรงกดดันขาลงที่แข็งแกร่ง เราเชื่อว่ามีโอกาสที่ราคาจะถึงระดับ 6/8
ในช่วงต้นของเซสชันอเมริกัน คู่สกุลเงิน EUR/USD กำลังซื้อขายอยู่ราว 1.1416 แสดงสัญญาณของการอ่อนแรงและกำลังอยู่ในช่วงการแก้ไขทางเทคนิคหลังจากแตะยอดของช่องทางขาขึ้นรอบระดับจิตวิทยาที่ 1.15 เรามีความเชื่อว่ายูโรอาจจะยังคงลดลงได้ เนื่องจากรูปแบบที่ต่อเนื่องของขาลงกำลังเกิดขึ้น คาดว่าอาจจะลดลงต่ำกว่า 1.1400 ซึ่งจากนั้นอาจจะลงไปถึงจุดต่ำสุดของช่องขาขึ้นที่ประมาณ 1.1297 หรือถึงค่าเฉลี่ยเคลื่อนที่เชิงพาณิชย์ (EMA)
วันนี้, คู่เงิน EUR/USD กำลังดึงดูดผู้ซื้อ, ฟื้นตัวจากความสูญเสียในวันศุกร์ที่ผ่านมาในขณะที่ดอลลาร์สหรัฐอ่อนลง จากมุมมองทางเทคนิค, คู่เงิน EUR/USD ในขณะนี้แสดงที่ว่าแข็งแรงอยู่ที่ต่ำกว่า Simple Moving Average (SMA) 100 ชั่วโมง
Your IP address shows that you are currently located in the USA. If you are a resident of the United States, you are prohibited from using the services of InstaFintech Group including online trading, online transfers, deposit/withdrawal of funds, etc.
If you think you are seeing this message by mistake and your location is not the US, kindly proceed to the website. Otherwise, you must leave the website in order to comply with government restrictions.
Why does your IP address show your location as the USA?
Please confirm whether you are a US resident or not by clicking the relevant button below. If you choose the wrong option, being a US resident, you will not be able to open an account with InstaTrade anyway.
We are sorry for any inconvenience caused by this message.


