อ่านรายละเอียดเพิ่มเติม


 01.07.2022 10:40 AM
As a result, the first month of trading in the summer has ended. We must acknowledge that the primary currency pair EUR/USD finished on a rather sad note. The US dollar is still strong, as demonstrated at the June auction when it faced up against all except the Swiss franc's primary rivals. However, this is entirely another tale. And I recommend looking at the most senior timeframe and summarizing the month's outcomes that ended yesterday in today's article on the euro/dollar.
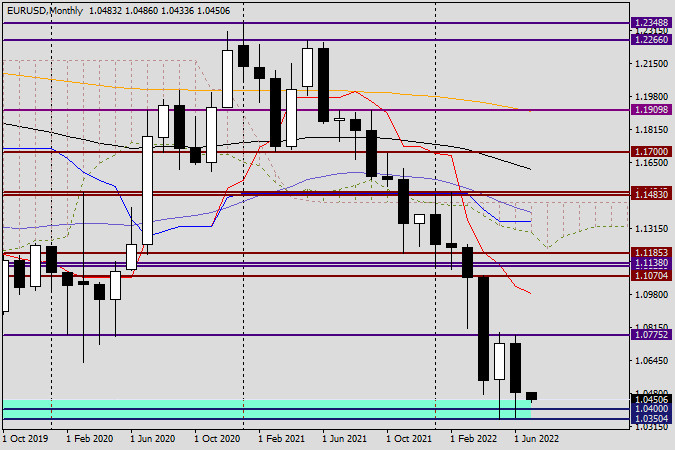
Monthly
You will first notice the major support area near 1.0350, which is now indubitably historical. The fall, which had already been noticed in 2017, was stopped by this sturdy technical level, as is evident on the chart. I recall that occasion and how parity, or the level of 1.0000, was expected for the euro/dollar at that time. Instead, the pair took action, turned upward, and not only turned around but also grew decently, rising to the level of 1.2555. Following that, both ups and downs were seen in the price dynamics of the EUR/USD, and as a result of all these moves, the quote fell back to levels last seen five years ago. The relatively large shadows of the last two monthly candles amply illustrate the strength of the 1.0350 level. But nothing endures forever. Once more, I'd guess that the pair would indeed move quickly toward parity in the event of a true collapse of the 1.0350-1.0300 price range. The ending of July trading above 1.0775 will likely pave the way for higher prices, possibly even to the Tenkan red line, which is positioned at 1.0983, or to another significant historical and technical level of 1.1000. This is easy to predict, given the lows and highs of the previous month. If the July trades close at 1.0339 (the January 2017 lows), the pair will undoubtedly anticipate a route to the south, whose ferocity will only grow.
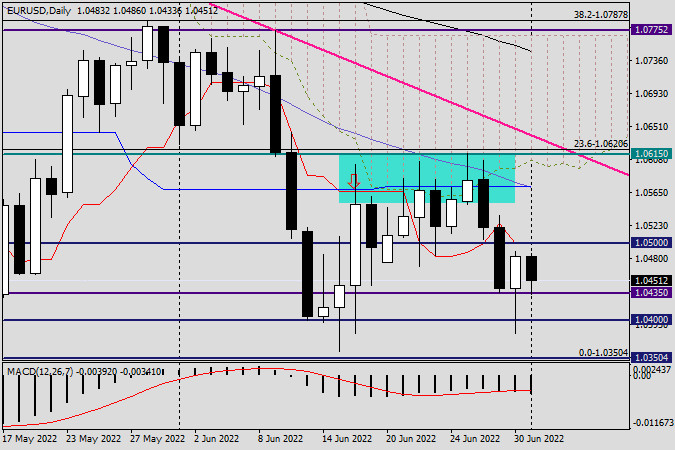
Daily
The EUR/USD pair displayed resilience throughout yesterday's trade. After attempting to breach another important key of 1.0400, it found firm support at 1.0383 and figuratively rose from the ashes to close Thursday's session at 1.0483. However, as the euro/dollar is currently trading below the red line of the Tenkan Ichimoku indicator, which is directly at this crucial level and the major psychological level of 1.0500, negative risks for the pair still exist. In this regard, it will be fascinating to see how the market will respond to today's eurozone inflation figures. I want to remind you that all versions of the eurozone consumer price index, including their base value, will be released at 10:00 London time. Since the European regulator has launched and postponed the issue of high inflation, I assume that the growth of consumer prices in the eurozone will be comparable to and, in some cases, even exceeding forecasts. This will support the single currency because it will be clearer that the ECB needs to turn its words into deeds. If technology is our only point of interest, then the bullish candle from yesterday with its lengthy lower shadow provides every reason to anticipate that the EUR/USD expansion may continue today. However, as is customary on the final trading day of the week, I won't provide any specific suggestions for trading. I assure you that this is not the ideal time.
You have already liked this post today
*บทวิเคราะห์ในตลาดที่มีการโพสต์ตรงนี้ เพียงเพื่อทำให้คุณทราบถึงข้อมูล ไม่ได้เป็นการเจาะจงถึงขั้นตอนให้คุณทำการซื้อขายตาม
คู่สกุลกำลังเคลื่อนไหวในกรอบแคบๆ ใต้ระดับแนวต้านที่ 1.1345 รอคอยผลการประชุมนโยบายการเงินของ Fed ซึ่งจะสรุปในวันพุธที่ 7 พฤษภาคม หาก Fed ตัดสินใจคงอัตราดอกเบี้ยหลักไว้ตามที่คาดการณ์ไว้ในขณะนี้ และแสดงความสงสัยเกี่ยวกับความเป็นไปได้ในการลดอัตราดอกเบี้ยในเดือนมิถุนายน คู่สกุลนี้อาจถูกกดดันและลดลงได้ ในแง่ของเทคนิค คู่สกุลนี้กำลังเคลื่อนไหวในกรอบด้านข้างระหว่าง
เมื่อวันศุกร์ คู่ EUR/USD ขยับขึ้นไปถึงระดับ 1.1374 แล้วดีดตัวออกมา กลับเป็นการเสริมค่าให้กับดอลลาร์สหรัฐอีกครั้ง ฝ่ายหมีจู่โจมอีกครั้ง แต่เพียงระยะเวลาสั้น ๆ และโดยรวมแล้วพวกเขายังคงค่อนข้างอ่อนแอ ดังนั้น ตามสถานการณ์ปัจจุบัน แนวโน้มขาขึ้นยังคงอยู่ การดีดตัวใหม่จากระดับ
ในกราฟรายชั่วโมง คู่สกุลเงิน GBP/USD ได้ลดลงต่อในวันศุกร์มุ่งหน้าสู่ระดับการปรับฐาน Fibonacci 161.8% ที่ 1.3249 การดีดตัวจากระดับนี้จะเป็นประโยชน์ต่อปอนด์อังกฤษและอาจนำไปสู่การเติบโตบางส่วนไปสู่ระดับ 1.3357 การปิดต่ำกว่าระดับ 1.3249 จะเพิ่มโอกาสในการลดลงต่อไปยังระดับ 1.3149 แนวโน้มขาขึ้นยังคงอยู่ในปัจจุบัน
ลิงก์ที่เป็นประโยชน์: บทความอื่นๆ ของฉันสามารถอ่านได้ในส่วนนี้ คอร์ส InstaForex สำหรับผู้เริ่มต้น การวิเคราะห์ยอดนิยม เปิดบัญชีการซื้อขาย สำคัญ: ผู้เริ่มต้นในตลาดซื้อขาย Forex ต้องระมัดระวังในการตัดสินใจเข้าตลาดเป็นอย่างมาก ก่อนการประกาศรายงานสำคัญ ควรหลีกเลี่ยงการเข้าตลาด เพื่อหลีกเลี่ยงการถูกจับอยู่ในสภาวะตลาดที่มีการแกว่งตัวรุนแรงเนื่องจากความผันผวนที่เพิ่มขึ้น
เมื่อปรากฏรูปแบบ Failing Wedge ในกราฟ 4 ชั่วโมง มันบ่งบอกว่าในอนาคตอันใกล้มีศักยภาพที่จะพุ่งไปสู่ระดับ 3297.43 และหากโมเมนตัมและความผันผวนอำนวย, ราคาทองคำจะเสริมความแข็งแกร่งอีกครั้งไปสู่ระดับ 3343.81 แต่หากในระหว่างทางไปสู่ระดับเหล่านี้ เกิดการแก้ไขการอ่อนตัวที่พุ่งผ่านและปิดต่ำกว่าระดับ 3201.44 ก็จะทำให้แผนการเสริมความแข็งแกร่งที่ได้กล่าวไว้ก่อนหน้าถูกยกเลิกและถือว่าเป็นโมฆะเองโดยอัตโนมัติ
หากพิจารณากราฟ 4 ชั่วโมงของคู่เงิน EUR/JPY ดูเหมือนว่าในอนาคตอันใกล้ EUR/JPY มีแนวโน้มที่จะแข็งค่าขึ้น ซึ่งได้รับการยืนยันจากการปรากฏของรูปแบบ Convergence ระหว่างการเคลื่อนไหวของราคาคู่เงิน EUR/JPY กับตัวชี้วัด Stochastic Oscillator และการเคลื่อนไหวของราคาคู่เงิน
ในช่วงต้นของตลาดอเมริกา ราคาทองคำซื้อขายอยู่ที่ประมาณ 3,223 ปรับตัวขึ้นหลังจากที่ลงมาถึงระดับต่ำสุดของ 5/8 Murray ประมาณ 3,203 คาดว่าทองคำจะยังคงฟื้นตัวต่อไปในอีกไม่กี่ชั่วโมงข้างหน้า อย่างไรก็ตาม เราอาจคาดว่าน่าจะมีการปรับฐานเกิดขึ้น เนื่องจากราคาเครื่องมือทางเทคนิคนี้ดูเหมือนจะอยู่ในสถานะที่ขายมากเกินไป ราคาทองคำอาจซื้อขายอยู่ระหว่าง 3,203 และอาจลงมาถึงก้นช่องขาลงที่ประมาณ
ในช่วงต้นของตลาดอเมริกา คู่สกุลเงิน EUR/USD กำลังซื้อขายอยู่ที่ประมาณ 1.1378 ภายในช่องแนวโน้มขาลงที่เกิดขึ้นเมื่อวันที่ 17 เมษายน และแสดงสัญญาณของการหมดพลังของแนวโน้มขาขึ้น มีความเป็นไปได้ที่จะเกิดการปรับฐานทางเทคนิคในอีกไม่กี่ชั่วโมงข้างหน้า และค่าเงินยูโรอาจร่วงลงไปยังจุดต่ำสุดของช่องแนวโน้มประมาณ 1.1150 ค่าเงินยูโรคงตัวอยู่หลายวันรอบๆ บริเวณ 1.1370
ลิงก์ที่มีประโยชน์: บทความอื่นๆของฉันสามารถหาอ่านได้ในส่วนนี้ คอร์ส InstaForex สำหรับผู้เริ่มต้น การวิเคราะห์ยอดนิยม เปิดบัญชีซื้อขาย สำคัญ: ผู้เริ่มต้นในตลาดฟอเร็กซ์จำเป็นต้องระมัดระวังเป็นอย่างยิ่งเมื่อตัดสินใจเข้าสู่ตลาด ก่อนการรายงานข้อมูลสำคัญควรหลีกเลี่ยงการเข้าตลาดเพื่อป้องกันการเผชิญกับความผันผวนที่เพิ่มขึ้นในตลาด ซึ่งอาจทำให้เกิดความผันผวนของราคาอย่างรุนแรง หากคุณตัดสินใจที่จะซื้อขายในช่วงที่มีการประกาศข่าว ควรตั้งคำสั่งหยุดขาดทุนเสมอเพื่อที่จะลดการสูญเสียให้น้อยที่สุด ถ้าไม่ได้ตั้งคำสั่งหยุดขาดทุน คุณอาจสูญเสียเงินฝากทั้งหมดได้อย่างรวดเร็ว
 InstaFutures
Make money with a new promising instrument!
ตัวเลขในInstaForex

Your IP address shows that you are currently located in the USA. If you are a resident of the United States, you are prohibited from using the services of InstaFintech Group including online trading, online transfers, deposit/withdrawal of funds, etc.
If you think you are seeing this message by mistake and your location is not the US, kindly proceed to the website. Otherwise, you must leave the website in order to comply with government restrictions.
Why does your IP address show your location as the USA?
Please confirm whether you are a US resident or not by clicking the relevant button below. If you choose the wrong option, being a US resident, you will not be able to open an account with InstaTrade anyway.
We are sorry for any inconvenience caused by this message.


