อ่านรายละเอียดเพิ่มเติม


 07.02.2022 09:58 AM
EUR/USD
Analysis:
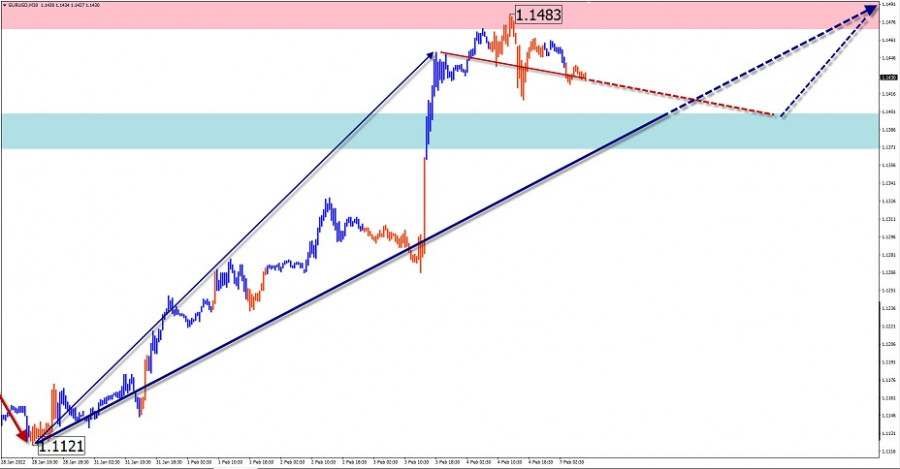
It is highly probable that the upward movement of the European currency from January 28 has given rise to a new wave in the main direction. The price has reached the resistance level of the large timeframe. Before the continuation of the uptrend, the wave level in the correction should be increased.
Outlook:
The euro is expected to move sideways between the closest encounter zones in the next 24 hours. Resumption of price growth is likely at the end of the day or tomorrow.
Potential reversal zones
Resistance:
- 1.1470/1.1500
Support:
- 1.1400/1.1370
Recommendations:
Until the end of the upcoming pullback, trading in the euro market could lead to losses. It is recommended to watch for reversal signals to open long positions at the end of the upcoming pullback.
USD/JPY
Analysis:
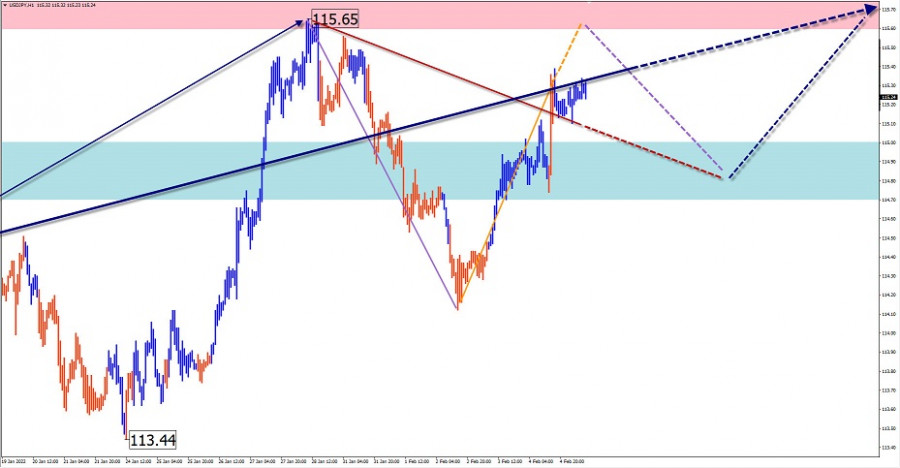
The main Japanese yen pair chart has been dominated by an uptrend since early last year. The incomplete section has been reporting since January 14. A correction has been forming in the wave structure during the last 2 weeks. There are no signals of its completion on the chart at the moment of analysis.
Outlook:
Today, there is a high probability of the yen price moving in the corridor between the closest areas of the counter direction. In the first half of the day, an upward vector is more likely. A rate shift and a rate decrease can be expected at the end of the day or tomorrow.
Potential reversal zones
Resistance:
- 115.60/115.90
Support:
- 115.00/114.70
Recommendations:
Trading in the Japanese yen market today is possible only within individual sessions, with fractional lots. Opening short positions is more risky.
GBP/JPY
Analysis:
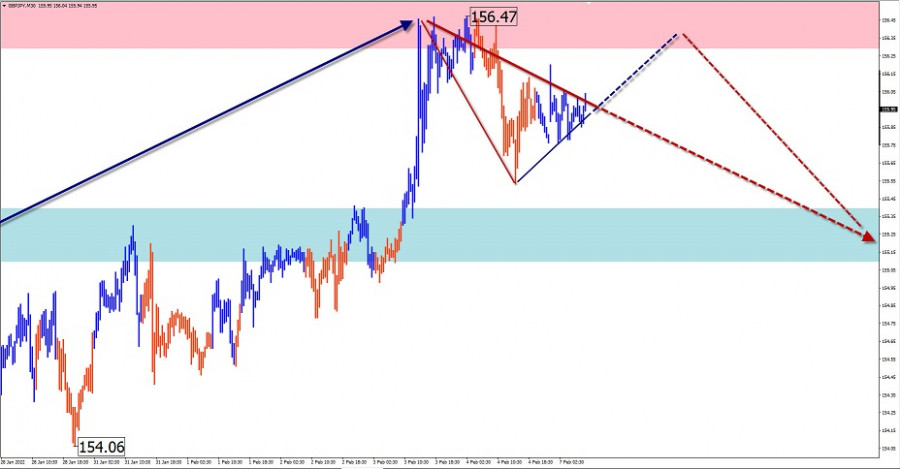
The chart of the English pound and Japanese yen continues its strong move to the north of the price chart. The unfinished section is timing from January 24. The price has reached a powerful resistance. The price needs to correct before it can continue its rise.
Outlook:
Price is expected to move mostly sideways in the coming days. In the first half of the day, an upward vector is more likely. In the resistance zone, a reversal and resumption of price decline can be expected further on.
Potential reversal zones
Resistance:
- 156.30/156.60
Support:
- 155.40/155.10
Recommendations:
In flat conditions, trades carry higher risk and are not recommended. It is optimal to refrain from trading the pair until a pullback is completed, with tracking signals for buying at the end of the pullback.
GOLD
Analysis:
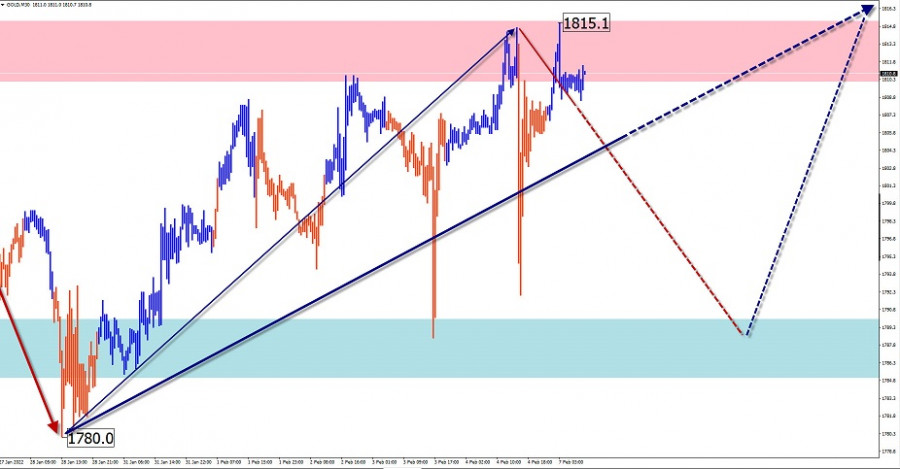
A flat rising wave has been forming on the gold chart since last March. Its structure most closely resembles a horizontal pennant, or a descending triangle. The last unfinished section is ascending from January 28. This wave has unconfirmed reversal potential so far.
Outlook:
In the coming trading sessions, there is a high probability of starting a downward flat from the resistance zone to the area of estimated support. After the end of it, we can expect a renewal of price growth.
Potential reversal zones
Resistance:
- 1810.0/1815.0
Support:
- 1790.0/1785.0
Recommendations:
There are no near-term trading conditions in the gold market. It is recommended to refrain from trading the instrument until there are confirmed buying signals at the end of the upcoming pullback.
Explanation: In simplified wave analysis (SVA), waves consist of 3 parts (A-B-C). The last unfinished wave is analysed. The solid arrow background shows the structure formed. The dotted arrow shows the expected movements.
Attention: The wave algorithm does not take into account the duration of the instrument movements over time!
You have already liked this post today
*บทวิเคราะห์ในตลาดที่มีการโพสต์ตรงนี้ เพียงเพื่อทำให้คุณทราบถึงข้อมูล ไม่ได้เป็นการเจาะจงถึงขั้นตอนให้คุณทำการซื้อขายตาม
โครงสร้างคลื่นในกราฟ EUR/USD ระยะเวลา 4 ชั่วโมงได้เปลี่ยนเป็นขาขึ้น ตอนนี้ผมเชื่อว่าไม่มีข้อสงสัยเลยว่าการเปลี่ยนแปลงนี้เกิดขึ้นเพียงเพราะนโยบายการค้าใหม่ของสหรัฐอเมริกาเท่านั้น จนถึงวันที่ 28 กุมภาพันธ์ — เมื่อการลดลงของค่าเงินดอลลาร์สหรัฐเริ่มต้น — โครงสร้างคลื่นทั้งหมดดูเหมือนแนวโน้มขาลงที่ชัดเจน โดยมีคลื่นขัดแย้งที่
รูปแบบคลื่นบนกราฟ 4 ชั่วโมงของคู่สกุลเงิน EUR/USD ได้เปลี่ยนไปมีโครงสร้างขาขึ้น ข้าพเจ้าเชื่อว่าไม่มีข้อสงสัยว่าการเปลี่ยนแปลงนี้เกิดขึ้นเพียงเพราะนโยบายการค้าของสหรัฐฯ ที่เปลี่ยนแปลงใหม่ จนถึงวันที่ 28 กุมภาพันธ์ เมื่อการลดลงอย่างรวดเร็วของดอลลาร์สหรัฐเริ่มต้นขึ้น โครงสร้างคลื่นทั้งหมดได้ก่อตัวเป็นแนวโน้มขาลงที่น่าเชื่อ สร้างคลื่นปรับฐาน 2 อย่างไรก็ตาม
โครงสร้างคลื่นสำหรับคู่ GBP/USD ได้เปลี่ยนไปเป็นโครงสร้างแนวโน้มขาขึ้นแบบเร้าใจ — "ขอบคุณ" โดนัลด์ ทรัมป์ รูปแบบคลื่นคล้ายกันมากกับคู่ EUR/USD ก่อนวันที่ 28 กุมภาพันธ์ เราสังเกตเห็นการพัฒนาโครงสร้างการแก้ไขที่น่าเชื่อซึ่งไม่มีสัญญาณเตือนใดๆ อย่างไรก็ตาม ความต้องการสำหรับดอลลาร์สหรัฐเริ่มลดลงอย่างรวดเร็วหลังจากนั้น
รูปแบบคลื่นบนกราฟ 4 ชั่วโมงสำหรับ EUR/USD ได้เปลี่ยนเป็นรูปแบบขาขึ้นแล้ว ฉันเชื่อว่าไม่มีข้อสงสัยว่าการเปลี่ยนแปลงนี้สืบเนื่องจากนโยบายการค้าที่ใหม่ของสหรัฐฯ จนถึงวันที่ 28 กุมภาพันธ์ เมื่อค่าเงินดอลลาร์สหรัฐฯเริ่มตกลงอย่างรวดเร็ว ทั้งหมดของโครงสร้างคลื่นดูเหมือนว่าเป็นช่วงแนวโน้มขาลงที่น่าเชื่อถือ โดยที่กำลังเกิดคลื่นปรับฐานที่ 2 ทว่า คำแถลงการณ์รายสัปดาห์จาก
รูปแบบคลื่นสำหรับ GBP/USD ก็ได้เปลี่ยนเป็นโครงสร้างคลื่นขาขึ้นเชิงโปร่งใส "ขอบคุณ" Donald Trump รูปแบบคลื่นเกือบจะเหมือนกับ EUR/USD จนถึงวันที่ 28 กุมภาพันธ์ เราสังเกตพัฒนาการของโครงสร้างการปรับฐานที่น่าเชื่อถือซึ่งไม่มีปัญหา อย่างไรก็ตาม ความต้องการของดอลลาร์สหรัฐฯ ก็เริ่มลดลงอย่างรวดเร็ว
โครงสร้างคลื่นบนกราฟ 4 ชั่วโมงของคู่สกุลเงิน EUR/USD ได้เปลี่ยนไปเป็นขาขึ้น ผมเชื่อว่าไม่มีใครสงสัยว่าการเปลี่ยนแปลงนี้เกิดขึ้นจากนโยบายการค้าของสหรัฐอเมริกาใหม่อย่างชัดเจน จนถึงวันที่ 28 กุมภาพันธ์ เมื่อเงินดอลลาร์สหรัฐเริ่มลดลงอย่างรวดเร็ว โครงสร้างคลื่นทั้งหมดดูเหมือนเป็นแนวโน้มขาลงที่น่าเชื่อถือ — การสร้างคลื่นแก้ไขที่ 2 อย่างไรก็ตาม
โครงสร้างคลื่นของ GBP/USD ได้เปลี่ยนไปสู่ความหมายขึ้นที่คมชัด ในทางการกระตุ้นซึ่งเป็นผลมาจาก "การช่วยเหลือ" ของดอนัลด์ ทรัมป์ รูปแบบคลื่นนั้นเหมือนกับ EUR/USD จนถึงวันที่ 28 กุมภาพันธ์ เราสังเกตการเริ่มปรับปรุงความถูกต้อง ที่เป็นน่าเชื่อถือ แต่หลังจากนั้นความต้องการสกุลเงินดอลลาร์สหรัฐฯ
GBP/USD การวิเคราะห์: ตั้งแต่เดือนมกราคมของปีนี้ คลื่นขาขึ้นได้กำหนดทิศทางราคาในคู่สกุลเงินหลักของปอนด์อังกฤษ หลังจากไปถึงขอบล่างของโซนการกลับตัวที่มีอิทธิพล ราคาก็เริ่มลดลงอย่างรวดเร็ว ซึ่งเป็นการเริ่มต้นของการปรับฐานที่เต็มรูปแบบ การคาดการณ์: การเคลื่อนไหวในด้านข้างคาดว่าจะเกิดขึ้นในครึ่งแรกของสัปดาห์บริเวณแนวต้าน เมื่อใกล้ถึงวันหยุดสุดสัปดาห์ ราคามีโอกาสที่จะเริ่มลดลงอีกครั้ง ซึ่งมีแนวโน้มว่าจะเป็นผลมาจากความผันผวนที่เพิ่มขึ้นหลังจากการประกาศข่าวสำคัญๆ โซนกลับตัวที่เป็นไปได้: แนวต้าน: 1.2950
EUR/USD วิเคราะห์: ตั้งแต่เดือนกุมภาพันธ์ ราคาของเงินยูโรได้เคลื่อนไหวตามรูปแบบคลื่นขาขึ้น ในช่วงเดือนที่ผ่านมา โครงสร้างคลื่นได้เกิดเป็นรูปแบบระนาบที่ยืดออกมา จุดสูงต่ำสุดในกราฟได้ก่อตัวเป็น "สามเหลี่ยมขยาย" ในขณะนี้ ส่วนสุดท้ายของคลื่น (C) กำลังพัฒนาอยู่ คาดการณ์: ราคามีแนวโน้มเคลื่อนไหวในลักษณะขวางภายในแนวต้านกัน ขึ้นทางเป็นไปได้ในช่วงต้นสัปดาห์
รูปแบบคลื่นบนกราฟ 4 ชั่วโมงของ EUR/USD กำลังจะเปลี่ยนเป็นโครงสร้างที่ซับซ้อนมากขึ้น ตั้งแต่วันที่ 25 กันยายนของปีที่แล้ว โครงสร้างคลื่นขาลงใหม่ได้เริ่มก่อตัวขึ้น เป็นรูปแบบห้าคลื่น และเมื่อสามเดือนที่ผ่านมามีโครงสร้างการปรับตัวขึ้นที่เริ่มก่อตัวขึ้น ซึ่งควรจะประกอบด้วยคลื่นอย่างน้อยสามคลื่น ลูกคลื่นอันแรกของการปรับตัวนี้มีรูปร่างที่ชัดเจน ดังนั้นฉันยังคาดหวังว่าคลื่นที่สองจะตามมาด้วยโครงสร้างที่ชัดเจน อย่างไรก็ตาม
อีเมล/SMS
การแจ้งเตือน

Your IP address shows that you are currently located in the USA. If you are a resident of the United States, you are prohibited from using the services of InstaFintech Group including online trading, online transfers, deposit/withdrawal of funds, etc.
If you think you are seeing this message by mistake and your location is not the US, kindly proceed to the website. Otherwise, you must leave the website in order to comply with government restrictions.
Why does your IP address show your location as the USA?
Please confirm whether you are a US resident or not by clicking the relevant button below. If you choose the wrong option, being a US resident, you will not be able to open an account with InstaTrade anyway.
We are sorry for any inconvenience caused by this message.


