อ่านรายละเอียดเพิ่มเติม


 12.11.2021 11:16 AM
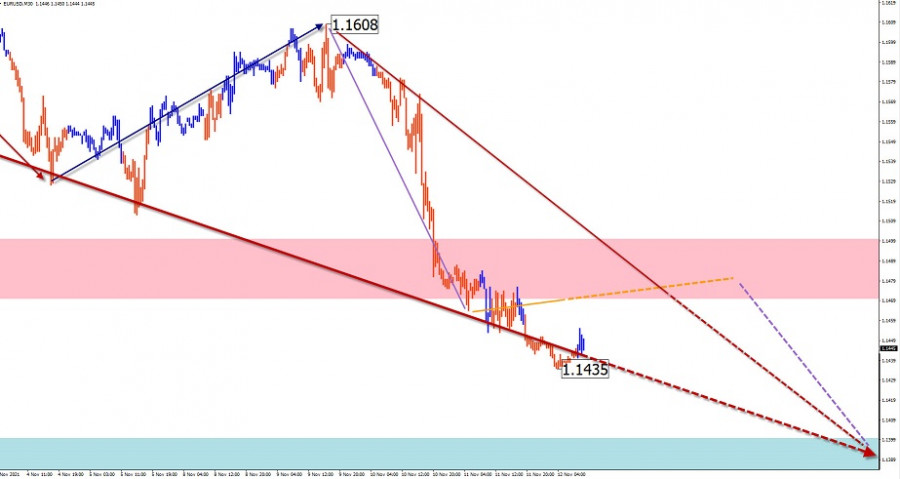
EUR/USD
Analysis:
The main direction of the intraday movement of the euro continues to be set by the descending wave from January 6. All counter-movements are within intermediate-term corrections. After breaking through another support, a new section on the main course has started.
Forecast:
A generally flat trading pattern is likely in the coming trading sessions. Short-term price rises are also possible, not beyond the resistance zone. A return to a downtrend is expected at the end of the day or tomorrow.
Potential reversal zones
Resistance:
- 1.1470/1.1500
Support:
- 1.1400/1.1370
Recommendations:
There are no conditions for buying on the euro market today. It is advisable to refrain from entering the market until the completion of the price pullback, with the search for signals to sell the instruments around the calculated resistance.
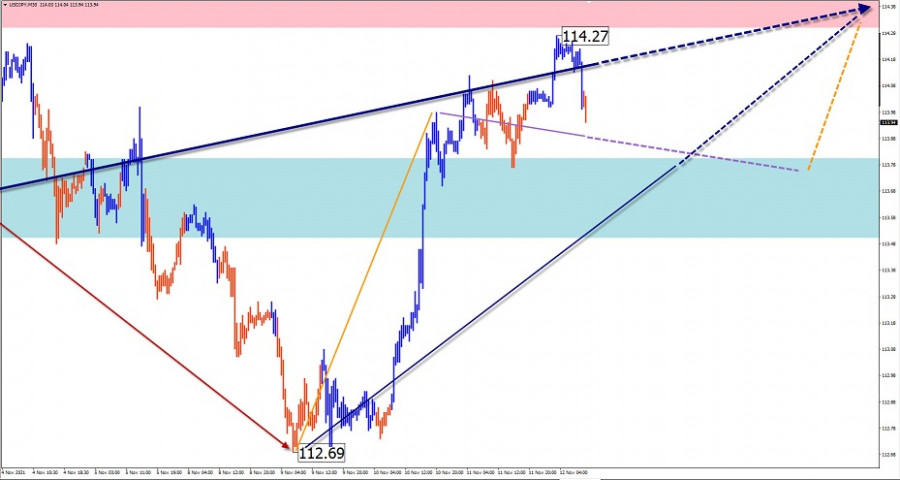
USD/JPY
Analysis:
A month-and-a-half-long bearish correction has ended on the Japanese yen major chart. The last leg of the uptrend started on November 9. The price is approaching the lower edge of the wide resistance zone of the upper TF.
Forecast:
In the coming day, the price is expected to move in a narrow range between the opposing zones. After an attempted pressure on the support zone, a change of vector and an upward price move is expected.
Potential reversal zones
Resistance:
- 114.30/114.60
Support:
- 113.80/113.50
Recommendations:
Trading in the Japanese yen market today can be risky. Short-term trades in fractional lots inside the price channel are possible.
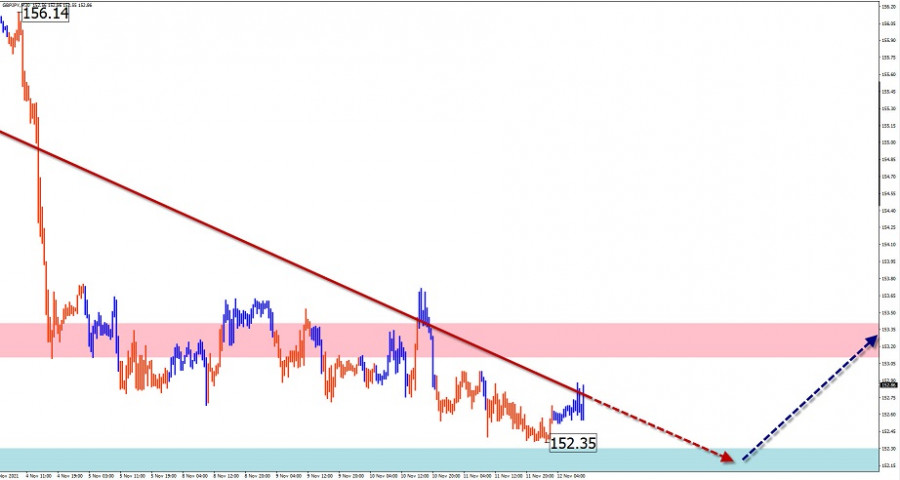
GBP/JPY
Analysis:
The pound/yen cross continues to move north on the price chart. The price has been forming an intermediate correction from the lower boundary of the strong resistance since October 20. By now the pair has reached a support level.
Forecast:
The general sideways price movement is expected to continue over the next 24 hours. In the second half of the day, after likely pressure on the support zone, a return to an upward vector can be expected, with prices rising towards the resistance zone.
Potential reversal zones
Resistance:
- 153.10/153.40
Support:
- 152.30/152.00
Recommendations:
Trading in this cross pair in the next 24 hours will only be possible in intraday trading with a reduced lot. Buying is more promising today.
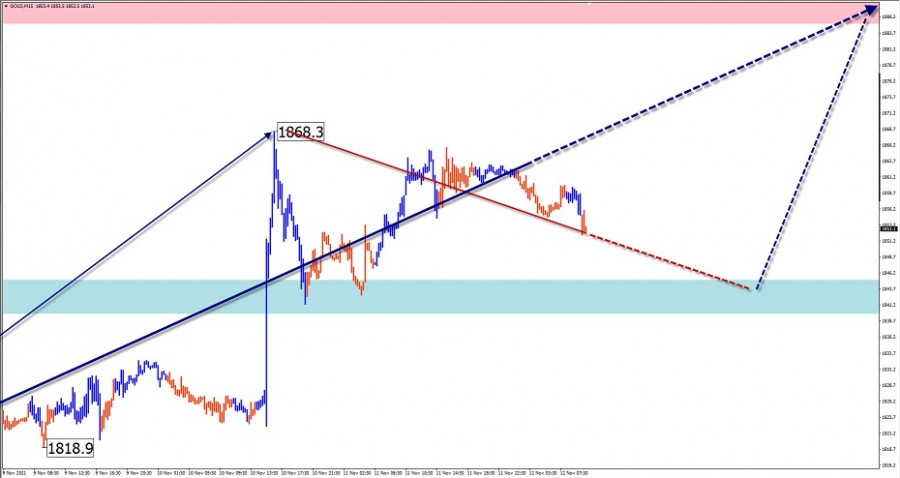
GOLD
Analysis:
On the gold market, an upward wave has been forming since the end of February. The incomplete portion of the wave dates back to September 30. The gold price is approaching the lower boundary of the potential reversal zone of the senior TF.
Forecast:
Today, the general upward movement is expected to continue. Short-term declines are possible in the European session, but not beyond the support zone. The highest activity is likely by the end of the day.
Potential reversal zones
Resistance:
- 1885.0/1890.0
Support:
- 1845.0/1840.0
Recommendations:
There are no conditions for selling on the gold market today. It is recommended to refrain from entering the instrument until there are clear buying signals around settlement support.
Explanation: In simplified wave analysis (SVA), waves consist of 3 parts (A-B-C). The last unfinished wave is analysed. The solid arrow background shows the structure formed. The dotted arrow shows the expected movements.
Attention: The wave algorithm does not take into account the duration of the instrument movements over time!
You have already liked this post today
*บทวิเคราะห์ในตลาดที่มีการโพสต์ตรงนี้ เพียงเพื่อทำให้คุณทราบถึงข้อมูล ไม่ได้เป็นการเจาะจงถึงขั้นตอนให้คุณทำการซื้อขายตาม
โครงสร้างคลื่นสำหรับ GBP/USD ได้แปรเปลี่ยนไปอยู่ในรูปแบบคลื่นขาขึ้น "ขอบคุณ" Donald Trump โครงสร้างคลื่นเกือบจะเหมือนกับคู่ EUR/USD จนกระทั่งวันที่ 28 กุมภาพันธ์ เราได้เห็นการก่อตัวของโครงสร้างการแก้ไขที่แข็งแกร่งซึ่งไม่ได้ทำให้เกิดความกังวลใด ๆ อย่างไรก็ตามหลังจากนั้น ความต้องการสำหรับดอลลาร์สหรัฐก็เริ่มลดลงอย่างรวดเร็ว
โครงสร้างคลื่นในกราฟราย 4 ชั่วโมงสำหรับคู่เงิน EUR/USD ได้เปลี่ยนเป็นรูปแบบ bullish และยังคงทรงตัวในลักษณะนั้น ฉันเชื่อว่าไม่มีใครสงสัยว่าเหตุการณ์นี้เกิดขึ้นเพียงเพราะนโยบายการค้าของสหรัฐฯ ที่ถูกปรับเปลี่ยนใหม่ จนกระทั่งวันที่ 28 กุมภาพันธ์ เมื่อการตกลงอย่างรุนแรงของดอลลาร์สหรัฐเริ่มต้นขึ้น รูปแบบคลื่นกำลังสร้างช่วงขาลงที่น่าเชื่อถือ โดยเป็นคลื่นแก้ไขที่
รูปแบบคลื่นของ GBP/USD ก็ได้เปลี่ยนไปเป็นโครงสร้างบูลลิชที่มีแรงขับเคลื่อน — "ขอบคุณ" Donald Trump ภาพคลื่นตอนนี้เหมือนกับ EUR/USD อย่างมาก จนถึงวันที่ 28 กุมภาพันธ์ เราได้เห็นการพัฒนาของโครงสร้างการปรับฐานที่ชัดเจนซึ่งไม่มีความกังวลแต่อย่างใด อย่างไรก็ตาม
โครงสร้างคลื่นบนกราฟ 4 ชั่วโมงของ EUR/USD ได้เปลี่ยนเป็นรูปแบบขาขึ้นและยังคงเป็นเช่นนั้น การเปลี่ยนแปลงนี้ไม่ต้องสงสัยเลยว่าเกิดขึ้นจากนโยบายการค้าใหม่ของสหรัฐฯ อย่างสมบูรณ์ ก่อนวันที่ 28 กุมภาพันธ์ เมื่อการลดลงอย่างรุนแรงของค่าดอลลาร์เริ่มต้นขึ้น โครงสร้างคลื่นทั้งหมดสะท้อนถึงเทรนด์ขาลงที่ชัดเจนซึ่งเป็นคลื่นแก้ไขที่ 2 อย่างไรก็ตาม การประกาศต่างๆ
โครงสร้างของคลื่นในกราฟ EUR/USD แบบ 4 ชั่วโมง ได้เปลี่ยนเป็นรูปแบบขาขึ้น ฉันเชื่อว่าแทบไม่มีข้อสงสัยใด ๆ เลยว่าการเปลี่ยนแปลงนี้เกิดจากนโยบายการค้าฉบับใหม่ของสหรัฐเท่านั้น จนถึงวันที่ 28 กุมภาพันธ์ เมื่อค่าเงินดอลลาร์สหรัฐเริ่มตกลงโครงสร้างคลื่นทั้งหมดชัดเจนว่าเป็นขาลง สิ่งที่กำลังเกิดขึ้นคือคลื่นปรับฐานที่
รูปแบบคลื่นสำหรับเครื่องมือ GBP/USD ก็ได้เปลี่ยนไปสู่โครงสร้างขาขึ้นและเร่งตัวเช่นเดียวกัน—"ขอบคุณ" Donald Trump รูปแบบคลื่นเกือบจะเหมือนกับ EUR/USD จนถึงวันที่ 28 กุมภาพันธ์ เราได้สังเกตเห็นโครงสร้างแก้ไขโทนแต้ไม่มีข้อกังวล อย่างไรก็ตาม ความต้องการเงินดอลลาร์สหรัฐเริ่มลดลงอย่างรวดเร็วตามมา ผลที่ได้คือการสร้างโครงสร้างห้าคลื่นขาขึ้น คลื่นที่
โครงสร้างคลื่นของ GBP/USD ได้เปลี่ยนไปเป็นรูปแบบขาขึ้นที่มีแรงกระตุ้นจาก "ความสำเร็จ" ของ Donald Trump ลักษณะคลื่นใกล้เคียงกับ EUR/USD เป็นอย่างมาก จนถึงวันที่ 28 กุมภาพันธ์ เราได้สังเกตเห็นการก่อตัวของโครงสร้างการแก้ไขที่ชัดเจนและไม่มีปัญหาใด
รูปแบบคลื่นบนกราฟ 4 ชั่วโมงของ EUR/USD ได้เปลี่ยนแปลงมาเป็นโครงสร้างขาขึ้น ผมเชื่อว่าไม่มีข้อสงสัยว่านี่เป็นผลมาจากนโยบายการค้าใหม่ของสหรัฐฯ ก่อนวันที่ 28 กุมภาพันธ์ เมื่อค่าเงินดอลลาร์สหรัฐเริ่มมีการลดค่าอย่างรุนแรง โครงสร้างคลื่นทั้งหมดดูเหมือนเป็นแนวโน้มขาลงที่ชัดเจน ส่วนที่เป็นคลื่นปรับฐาน 2 กำลังถูกสร้างขึ้น อย่างไรก็ตาม
รูปแบบแนวโน้มของ GBP/USD ได้ปรับเปลี่ยนเป็นโครงสร้างขาขึ้นในลักษณะกระตุ้น—"ต้องขอบคุณ" Donald Trump รูปแบบนี้คล้ายคลึงกับ EUR/USD จนถึงวันที่ 28 กุมภาพันธ์ เราเห็นโครงสร้างการแก้ไขที่ดูน่าเชื่อถือ ซึ่งไม่ได้สร้างความกังวล อย่างไรก็ตาม ความต้องการเงินดอลลาร์สหรัฐเริ่มลดลงอย่างรวดเร็ว ส่งผลให้เกิดโครงสร้างขาขึ้นแบบห้าคลื่นขึ้น
รูปแบบคลื่นในกราฟ 4 ชั่วโมงของ EUR/USD ได้เปลี่ยนเป็นโครงสร้างขาขึ้น ผมเชื่อว่าแทบไม่มีข้อสงสัยเลยว่าการเปลี่ยนแปลงนี้เกิดขึ้นโดยสิ้นเชิงเนื่องจากนโยบายการค้าของสหรัฐฯ ที่เปลี่ยนไป จนถึงวันที่ 28 กุมภาพันธ์ ซึ่งเป็นช่วงที่ค่าเงินดอลลาร์สหรัฐเริ่มตกต่ำลงอย่างรุนแรง โครงสร้างคลื่นทั้งหมดดูเหมือนเป็นช่วงแนวโน้มขาลงที่น่าเชื่อถือ โดยมีคลื่นแก้ไขที่ 2 กำลังเกิดขึ้น
ตารางของ Forex
เวอร์ชั่นแบบ หน้าเว็บไซต์

Your IP address shows that you are currently located in the USA. If you are a resident of the United States, you are prohibited from using the services of InstaFintech Group including online trading, online transfers, deposit/withdrawal of funds, etc.
If you think you are seeing this message by mistake and your location is not the US, kindly proceed to the website. Otherwise, you must leave the website in order to comply with government restrictions.
Why does your IP address show your location as the USA?
Please confirm whether you are a US resident or not by clicking the relevant button below. If you choose the wrong option, being a US resident, you will not be able to open an account with InstaTrade anyway.
We are sorry for any inconvenience caused by this message.


