อ่านรายละเอียดเพิ่มเติม


 11.11.2021 11:25 AM
Last Friday, Bitcoin has updated the historical high twice but has not managed to break through the resistance at $70,800. Moreover, the cryptocurrency allowed a sharp surge in the growth of volatility following the results of yesterday. This is due to big speculative news that allowed the asset to set a new ATH and fall to a local low after a few hours. As a result, a situation was formed, in which Bitcoin's immediate plans were knocked down by a wave of impulse sales and purchases.
Due to the results of the Fed meeting, where they announced record inflation growth rates for 30 years, the price soared to $69,000. But despite this, the asset failed to break through the $70,000 mark, which also caused a local price reversal. However, the main catalyst for the fall in the BTC price was the excitement in related markets caused by the latest rumors about the bankruptcy of the Chinese developer Evergrande. Yesterday, the company had to pay more than $145 million in interest on securities but did not do it on time, which meant the actual onset of bankruptcy. The market began an immediate reaction to the unverified news, which triggered a correction. Given the fact that the last HANDICAP was established in correlation with the indices of the US financial markets, the price decline and excitement spread to the neighboring market.
However, the news turned out to be fake. The developer made the payment, as reported by representatives of creditors. Despite this, Bitcoin quotes collapsed by 9%, namely from $69k to $62k, which led to the mass liquidation of positions. The total amount of liquidated positions was $700 million, and the largest order was opened in the amount of $65 million paired with ADA. Bitcoin's decline caused a chain reaction, and the entire cryptocurrency market was in the red zone. The total capitalization of all assets fell to $2.86 trillion, and the bitcoin price recovered to $65,200. The price made a rebound from the local support zone at $62,700, after which it hesitantly recovered to the current values.
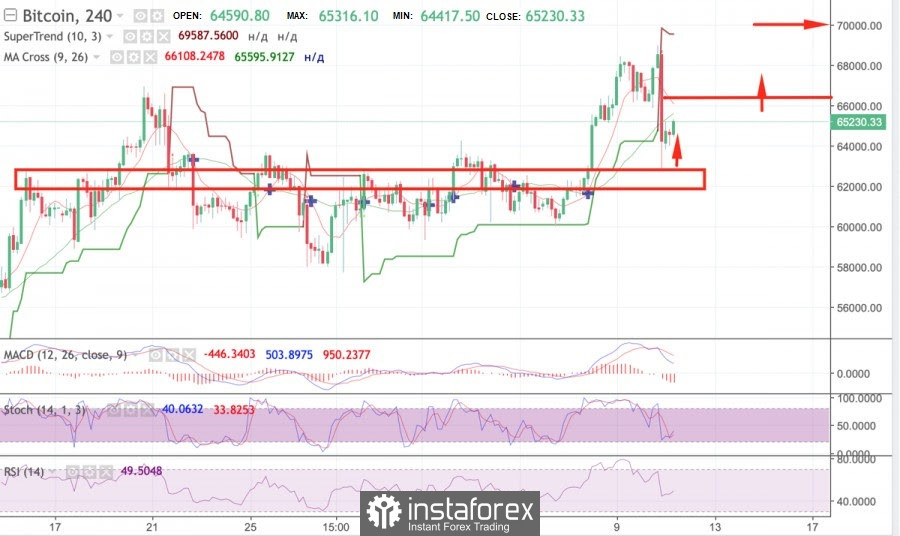
On the four-hour chart, BTC plunged beyond the super trend line, but it is not worth taking this as a change in the medium-term direction of price movement, since the collapse was the result of the impulsive behavior of the players. Now, overcoming the psychological level of $70,00 is postponed due to the need for a local recovery period, which may take some time. In addition to the ATH levels, the price will meet resistance at $66,400 and $68,00. An uncertain red "doji" candle formed on the chart, which meant the interception of the initiative by the bulls, which was reflected in the technical indicators. The stochastic oscillator began an upward movement after the formation of a bullish intersection, and the relative strength index is moving towards the 60 mark within the bullish zone, which indicates an increase in buyer interest. At the same time, there is a downward signal expressed in the divergence between the price movement and the MACD oscillator. Given this, a local pullback at $66,400 can be assumed.
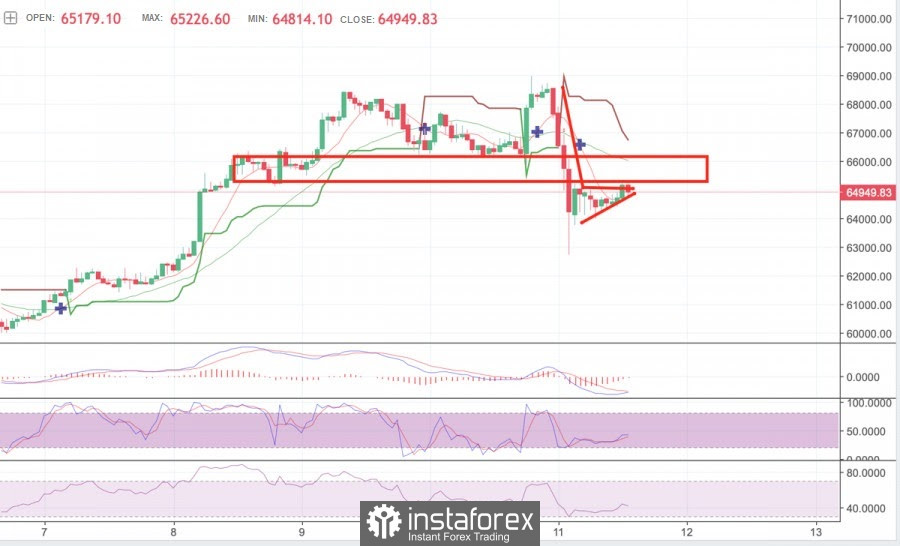
As for the hourly chart, Bitcoin has exhausted the local bullish momentum, which is expressed in the formation of a red candle after a series of uncertain green ones. This is also due to the approach to the local resistance level at $65,247. In addition, a technical analysis figure has formed on the charts. There will be a bullish pennant with an upward compression, at the breakdown of which the price can receive an additional upward impulse. The bullish breakdown of this local pattern is important for further recovery, as technical indicators indicate the weakness of buyers: MACD and stochastic are moving flat and can make a reversal in any direction, and the relative strength index is declining to around 40. The breakdown of the pennant will set the dynamics of the price movement for the next few hours, and the approximate recovery rates will be clear from it, other things being equal in the market.
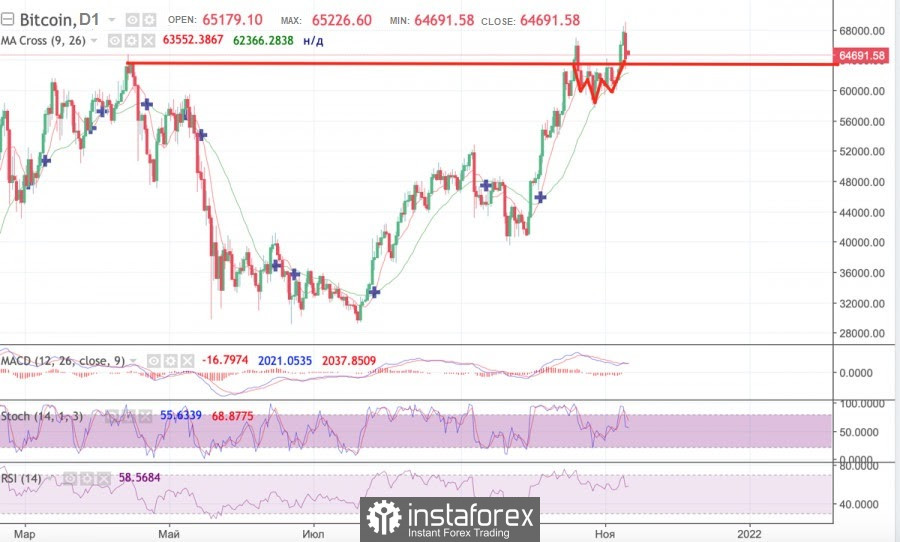
The "head and shoulders" technical analysis figure was formed on the daily chart, indicating a trend reversal, which is a bearish signal to retest key support levels. This is indicated by technical indicators: the MACD began to decline after the formation of a local bearish intersection, but the stochastic and the relative strength index begin to align and move flat. Despite this, the formation of a full-fledged bearish pattern indicates a further decline in the price. The nearest support zones are located at the levels of $64,400, $58,000, and $53,600.
You have already liked this post today
*บทวิเคราะห์ในตลาดที่มีการโพสต์ตรงนี้ เพียงเพื่อทำให้คุณทราบถึงข้อมูล ไม่ได้เป็นการเจาะจงถึงขั้นตอนให้คุณทำการซื้อขายตาม
แม้ว่าอาจจะมีการหยุดชั่วคราวบ้าง แต่ Bitcoin และ Ethereum ดูเหมือนจะยังไม่สิ้นสุดแนวโน้มขาขึ้นของพวกเขา ในขณะที่ Bitcoin มีการถอยกลับเล็กน้อยในช่วงการซื้อขายในเอเชียวันนี้ Ethereum ได้ทำลายสถิติใหม่ไปสู่จุดสูงสุดรายสัปดาห์แล้ว เหตุผลหนึ่งที่อาจอยู่เบื้องหลังการเข้าซื้อเมื่อวานนี้อาจเป็นข่าวลือว่า Trump Media
รูปแบบกราฟในกรอบเวลาสี่ชั่วโมงของ BTC/USD เริ่มมีความซับซ้อนมากขึ้นแล้ว โครงสร้างการปรับฐานลงได้สิ้นสุดการก่อตัวที่ระดับประมาณ $75,000 หลังจากนั้นการเคลื่อนไหวขาขึ้นที่ค่อนข้างแข็งแกร่งก็เริ่มต้นขึ้น ซึ่งอาจจะเป็นสัญญาณของแนวโน้มขาขึ้นแบบแรงดัน ในช่วงที่สองของส่วนนี้ดูค่อนข้างสั้นและไม่มั่นคงนัก แต่ความต้องการใน Bitcoin ยังคงเติบโตเรื่อยๆ ซึ่งเป็นสัญญาณของ 'การกระตุ้น' สถานการณ์ข่าวสนับสนุน Bitcoin
ความต้องการสำหรับ bitcoin และ ether ยังคงมีต่อเนื่องในช่วงต้นสัปดาห์นี้ Bitcoin ยังคงอยู่เหนือระดับ $109,000 ขณะที่ Ethereum กำลังพยายามประคองที่ระดับเหนือ $2,600 ข่าวเมื่อวานที่ว่า Strategy ได้ดำเนินการซื้อ
บิทคอยน์กลับมาขยับขึ้นอีกครั้งและได้ทะลุระดับ $109,900 แล้ว หลังจากการปรับฐานที่ระดับ $106,000 เมื่อช่วงสุดสัปดาห์ที่ผ่านมา การที่ราคายังยืนเหนือระดับ $107,000 ได้และฟื้นตัวขึ้นอย่างแข็งแกร่งจากระดับนั้น ทำให้มีมุมมองเชิงบวกต่อตลาดสกุลเงินดิจิทัล ระดับราคานี้ได้กลายเป็นเขตการสนับสนุนที่สำคัญอย่างชัดเจน บ่งบอกว่าผู้ซื้อกำลังเข้าสู่ตลาดอย่างแข็งขันเพื่อป้องกันการลดลงเพิ่มเติม สถานการณ์ตลาดที่มีแนวโน้มบวกยังได้รับการสนับสนุนโดยปัจจัยสำคัญหลายประการ ประการแรก ความสนใจของสถาบันในคริปโตเคอร์เรนซี
ความต้องการสำหรับ Bitcoin และ Ethereum ได้กลับมาเพิ่มขึ้นอีกครั้งในช่วงต้นสัปดาห์นี้ Bitcoin ได้ทะลุระดับ $109,000 ขึ้นไปแล้ว ในขณะที่ Ethereum กำลังพยายามรวบรวมกำลังเพื่อยืนอยู่เหนือระดับ $2,550 เมื่อวานนี้ Paolo
บิทคอยน์ยังคงสร้างโครงสร้างแนวโน้มกระทิงต่อเนื่อง อาจมีข้อถกเถียงได้ว่าในขณะนี้มีเหตุผลจริงในการสร้างแนวโน้มกระทิงรอบใหม่หรือไม่ แต่จากชาร์ตนั้นบ่งบอกอย่างชัดเจนเท่านั้น—อย่างไม่มีข้อกังขา เพราะว่าขณะนี้มีการสร้างคลื่นขาขึ้นขึ้นมา เทรดเดอร์สามารถทำได้เพียงรอให้ราคาย่างก้าวเข้าสู่โซนที่สนใจเพื่อให้มีโอกาสเข้าซื้อในทิศทางขาขึ้น ซึ่งโซนเหล่านี้คือ Imbalance 3 และ 4 การกลับไปยังพื้นที่ที่เกิดภาวะไม่สมดุลจะหมายถึงตลาดได้ปรับราคาสมดุลแล้ว จากนั้นการเติบโตของ Bitcoin อาจดำเนินต่อไป สำหรับผม
ดูเหมือนว่าการเคลื่อนไหวของราคาของ Doge Cryptocurrency ในกราฟ 4 ชั่วโมง กำลังเคลื่อนที่เหนือ WMA (21) ซึ่งมีความชันขึ้นไปด้านบน และตัวบ่งชี้ Stochastic Oscillator กำลังพร้อมที่จะข้ามสัญญาณซื้อ (BUY)
หากเราดูที่กราฟ 4 ชั่วโมงของสกุลเงินดิจิทัล Ripple จะเห็นได้ว่ามันเคลื่อนตัวขึ้นเหนือ WMA (21) ซึ่งมีความชันสูงและประสบความสำเร็จในการทะลุขึ้นเหนือระดับ High Value Area (สีเหลือง) แล้วต่อไปเคลื่อนตัวขึ้นเหนือพื้นที่สีน้ำเงิน (ค่าเฉลี่ย) และอยู่ในพื้นที่ที่มีอารมณ์ของผู้ซื้อซึ่งค่อนข้างมาก
ในวันพฤหัสบดี ราคาของ Bitcoin ได้แตะระดับเป้าหมายที่ 111,770 การแกว่งตัวของออสซิลเลเตอร์ Marlin ดูเหมือนจะตามหลังราคาอยู่ ทำให้เกิดภาพของการแยกตัวที่ไม่เป็นไปตามมาตรฐานชั้นสูง แต่ในขณะนี้ เรายังคงยึดตามสถานการณ์ที่ออสซิลเลเตอร์จะพัฒนาอยู่ภายในช่องแนวโน้มขึ้นระยะยาว การปรับฐานจากระดับปัจจุบันมีความเป็นไปได้อย่างแน่นอน ระดับอ้างอิงคือ 109,985 ซึ่งเป็นระดับสูงสุดเมื่อวันที่
อีเมล/SMS
การแจ้งเตือน

Your IP address shows that you are currently located in the USA. If you are a resident of the United States, you are prohibited from using the services of InstaFintech Group including online trading, online transfers, deposit/withdrawal of funds, etc.
If you think you are seeing this message by mistake and your location is not the US, kindly proceed to the website. Otherwise, you must leave the website in order to comply with government restrictions.
Why does your IP address show your location as the USA?
Please confirm whether you are a US resident or not by clicking the relevant button below. If you choose the wrong option, being a US resident, you will not be able to open an account with InstaTrade anyway.
We are sorry for any inconvenience caused by this message.


