อ่านรายละเอียดเพิ่มเติม


 05.11.2021 09:28 AM
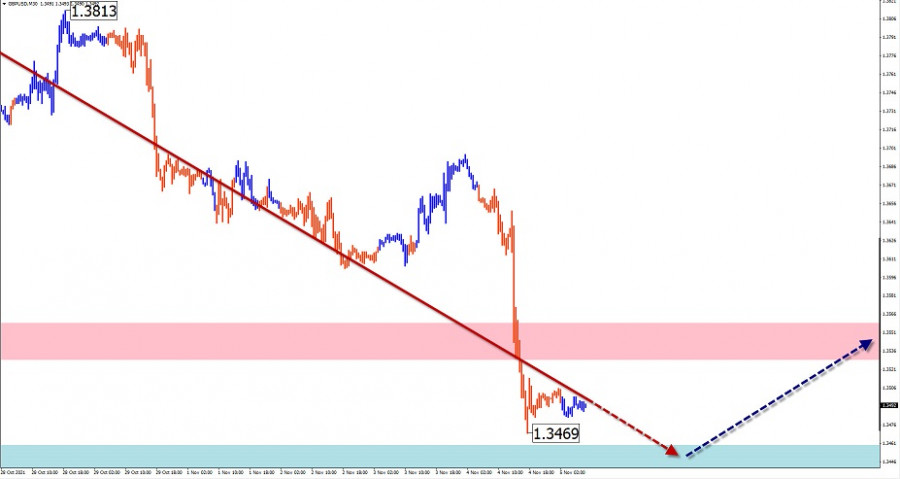
GBP/USD
Analysis:
The latest incomplete section of the English pound's market-dominating uptrend has been running since September 29. The pair's price has been declining over the past three weeks, forming a correction (B). The price is approaching the upper boundary of the potential reversal zone of the large TF.
Forecast:
In the first half of the day, we can expect a flat trend for the pair. An upward vector is possible, with a gradual rise to resistance zone levels. By the end of the day, there is an increased probability of rising volatility, reversal, and a renewed decline.
Potential reversal zones
Resistance:
- 1.3530/1.3560
Support:
- 1.3460/1.3430
Recommendations:
Pound trading is rather risky today. Short-term selling from the resistance zone is possible. It is better to not trade until there are strong buying signals in the area of the support zone.
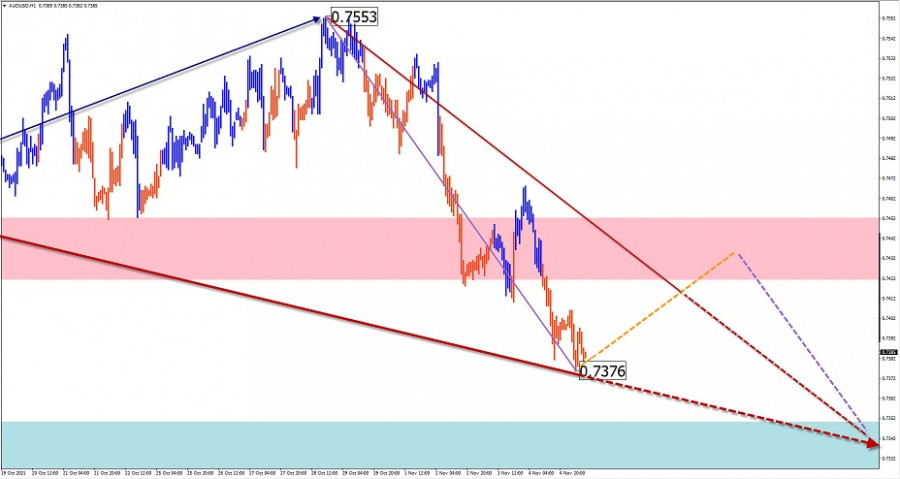
AUD/USD
Analysis:
Since last March, the pair's market has been dominated by an up-trend. The uptrend from August 20 has reversal potential. From the intermediate resistance, the price has been forming a correction during the last two weeks. Its structure at the time of the analysis does not look complete.
Forecast:
In the upcoming European session, the pair's price is expected to move sideways. There could be a short-term price increase, not further than the resistance zone. A return to a bearish rate can be expected by the end of the day.
Potential reversal zones
Resistance:
- 0.7420/0.7450
Support:
- 0.7350/0.7320
Recommendations:
There are no buying conditions in the Australian dollar market today. Short-term selling from the resistance zone with a smaller lot is possible.
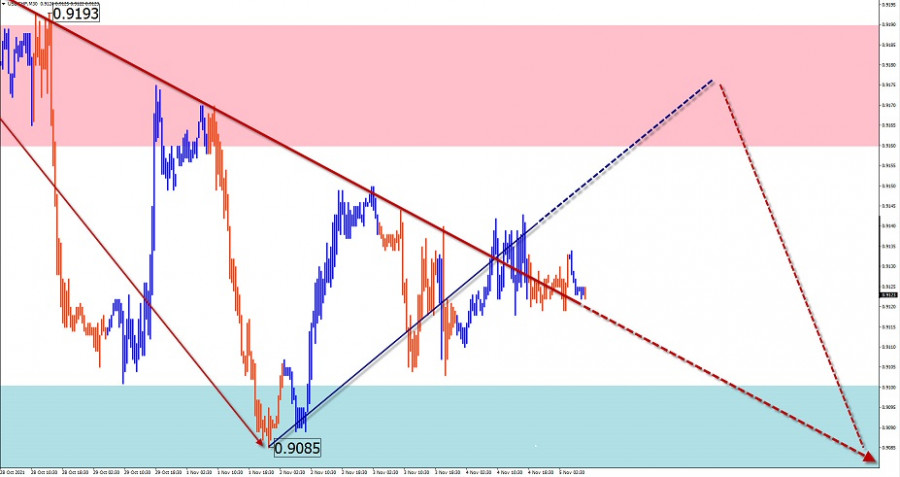
USD/CHF
Analysis:
On the chart of the Swiss franc against the American currency incomplete wave structure at the time of analysis is the descending wave from June 18. Within its final part (C), the price has been forming a flat pullback since the end of last month.
Forecast:
The general sideways movement is expected to continue today. The upper boundary of the price swing is in the area of settlement resistance. At the end of the day, there is a high probability of a return to a bearish course.
Potential reversal zones
Resistance:
- 0.9160/0.9190
Support:
- 0.9100/0.9070
Recommendations:
Trading in the Swiss franc market today could lead to losses. It is recommended not to enter into the market until the current pullback is over, looking for selling signals around the resistance zone.
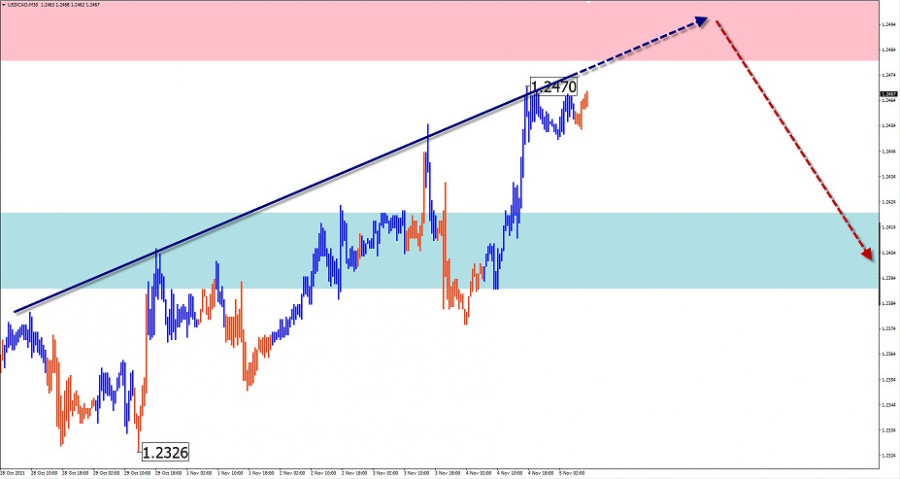
USD/CAD
Analysis:
The downward wave of the main Canadian dollar pair chart, which started in August, continues its formation. The bullish section from October 21 forms an intermediate pullback in the final part (C).
Forecast:
In the next 24 hours, the entire upward movement is expected to end, reverse and start a counter decline. The boundaries of the expected daily range are indicated by the settlement zones.
Potential reversal zones
Resistance:
- 1.2480/1.2510
Support:
- 1.2420/1.2390
Recommendations:
There are no conditions for buying in the Canadian dollar market today. It is recommended to follow all emerging signals to sell the instrument in the area of settlement resistance.
Explanations: In simplified wave analysis, waves consist of 3 parts (A-B-C). The last unfinished wave is analyzed. The solid arrow background shows the formed structure, the dotted background shows the expected movements.
Attention: The wave algorithm does not take into account the duration of instrument movements!
You have already liked this post today
*บทวิเคราะห์ในตลาดที่มีการโพสต์ตรงนี้ เพียงเพื่อทำให้คุณทราบถึงข้อมูล ไม่ได้เป็นการเจาะจงถึงขั้นตอนให้คุณทำการซื้อขายตาม
รูปแบบคลื่นของคู่เงิน GBP/USD ยังคงบ่งบอกถึงการก่อตัวของโครงสร้างคลื่นขาขึ้นแบบกระทิง ต้องขอบคุณ Donald Trump ภาพคลื่นคล้ายกับคู่ EUR/USD มาก จนถึงวันที่ 28 กุมภาพันธ์ เราเห็นการพัฒนาของโครงสร้างแก้ไขที่ชัดเจน ซึ่งไม่ได้ก่อให้เกิดความกังวลใด
โครงสร้างคลื่นบนแผนภูมิ EUR/USD แบบ 4 ชั่วโมงได้เปลี่ยนแปลงเปลี่ยนเป็นขาขึ้นและยังคงรักษารูปแบบนั้น ผมเชื่อว่าไม่มีข้อสงสัยว่าการเปลี่ยนแปลงนี้เกิดขึ้นจากนโยบายการค้าใหม่ของสหรัฐอเมริกาอย่างเดียว จนถึงวันที่ 28 กุมภาพันธ์ เมื่อการลดลงอย่างรวดเร็วของดอลลาร์สหรัฐเริ่มต้นขึ้น โครงสร้างคลื่นทั้งหมดยังคงดูเหมือนโครงสร้างแนวโน้มขาลงที่มีความน่าเชื่อถือ โดยสร้างคลื่นปรับฐานที่ 2 อย่างไรก็ตาม การประกาศรายสัปดาห์ของโดนัลด์
รูปแบบคลื่นในแผนภูมิ 4 ชั่วโมงได้เปลี่ยนเป็นโครงสร้างขาขึ้นและยังคงอยู่ในสถานะนั้น ฉันเชื่อว่าไม่มีข้อสงสัยว่าการเปลี่ยนแปลงนี้เกิดขึ้นเนื่องจากนโยบายการค้าใหม่ของสหรัฐฯ เท่านั้น จนถึงวันที่ 28 กุมภาพันธ์เมื่อมีการลดลงอย่างรวดเร็วของดอลลาร์สหรัฐ โครงสร้างคลื่นทั้งหมดดูเหมือนจะเป็นช่วงขาลงที่น่าเชื่อมาซึ่งเป็นการสร้างคลื่นปรับตัว 2 อย่างไรก็ตาม การประกาศในแต่ละสัปดาห์โดย Trump เกี่ยวกับภาษีต่างๆ ได้ทำงานของเขา
GBP/USD วิเคราะห์: ตั้งแต่วันที่ 8 เมษายน GBP/USD ได้เคลื่อนตัวขึ้นบนกราฟราคา จากขีดจำกัดล่างของโซนแนวโน้มการกลับตัว มีการสร้างการแก้ไขกลับกันในช่วงสองเดือนที่ผ่านมา การขาขึ้นตั้งแต่วันที่ 21 พฤษภาคมมีศักยภาพในการกลับตัว หากได้รับการยืนยันแนวโน้มระยะสั้นอาจจะกลับมาในเส้นทางขาขึ้นหลักอีกครั้ง คาดการณ์: ในอีกไม่กี่วันข้างหน้า
EUR/USD วิเคราะห์: ตั้งแต่เดือนกุมภาพันธ์เป็นต้นมา กราฟ EUR/USD ได้ก่อตัวเป็นคลื่นขาขึ้น ในช่วงเดือนครึ่งที่ผ่านมา ส่วนปรับฐาน (B) ได้เต็มที่ภายในคลื่นนี้ ซึ่งยังไม่เสร็จสมบูรณ์ เมื่อสัปดาห์ที่แล้ว ราคาได้ทะลุระดับแนวรับที่แข็งแกร่ง ซึ่งตอนนี้กลายเป็นแนวต้าน ตัวบ่งชี้หลายตัวชี้แนะว่าคลื่นปรับฐานอยู่ในช่วงสุดท้ายแล้ว
โครงสร้างคลื่นสำหรับเครื่องมือ GBP/USD ยังคงบ่งบอกถึงการสร้างลำดับคลื่นขาขึ้นที่เป็นแบบเกิดแรงกระตุ้น เนื่องจากผลของ Donald Trump ทำให้รูปแบบคลื่นนี้คล้ายคลึงกับ EUR/USD มาก จนถึงวันที่ 28 กุมภาพันธ์ เราได้เห็นการพัฒนาโครงสร้างการปรับแก้ที่น่าเชื่อถือซึ่งไม่ได้สร้างความกังวลใดๆ อย่างไรก็ตาม ความต้องการสำหรับดอลลาร์สหรัฐเริ่มลดลงอย่างรวดเร็ว
โครงสร้างคลื่นในกราฟ 4 ชั่วโมงของคู่เงิน EUR/USD ได้เปลี่ยนแปลงไปในทิศทางขาขึ้น และยังคงรักษาการก่อตัวนี้เอาไว้ ผมเชื่อว่าไม่มีข้อสงสัยใดๆ ว่าการเปลี่ยนแปลงนี้เกิดขึ้นเฉพาะจากนโยบายการค้าของสหรัฐฯ ที่เพิ่งประกาศใหม่ จนถึงวันที่ 28 กุมภาพันธ์ เมื่อลดลงอย่างเฉียบพลันของค่าเงินดอลลาร์สหรัฐ โครงสร้างคลื่นทั้งหมดดูเหมือนจะเป็นช่วงแนวโน้มขาลงที่น่าเชื่อถือ คลื่น
รูปแบบคลื่นบนกราฟ 4 ชั่วโมงของ EUR/USD ได้เปลี่ยนไปสู่โครงสร้างขาขึ้นและยังคงเป็นเช่นนั้น ไม่ต้องสงสัยเลยว่าการเปลี่ยนแปลงนี้เกิดขึ้นเพียงเพราะนโยบายการค้าฉบับใหม่ของสหรัฐฯ จนถึงวันที่ 28 กุมภาพันธ์ ซึ่งดอลลาร์เริ่มลดลงอย่างมาก โครงสร้างคลื่นยังคงเป็นแนวโน้มขาลงที่ชัดเจน กำลังสร้างคลื่นปรับฐานที่ 2 อย่างไรก็ตาม การประกาศประจำสัปดาห์ของทรัมป์เกี่ยวกับภาษีต่าง
รูปแบบคลื่นสำหรับ GBP/USD ได้เปลี่ยนเข้าสู่โครงสร้างขาขึ้นเชิงแรงกระตุ้น — "ขอบคุณ" โดนัลด์ ทรัมป์ ภาพคลื่นเกือบจะเหมือนกับ EUR/USD จนถึงวันที่ 28 กุมภาพันธ์ เราสังเกตเห็นโครงสร้างการปรับฐานที่ชัดเจนซึ่งไม่มีความกังวลใด ๆ อย่างไรก็ตาม
โครงสร้างคลื่นสำหรับ GBP/USD ได้แปรเปลี่ยนไปอยู่ในรูปแบบคลื่นขาขึ้น "ขอบคุณ" Donald Trump โครงสร้างคลื่นเกือบจะเหมือนกับคู่ EUR/USD จนกระทั่งวันที่ 28 กุมภาพันธ์ เราได้เห็นการก่อตัวของโครงสร้างการแก้ไขที่แข็งแกร่งซึ่งไม่ได้ทำให้เกิดความกังวลใด ๆ อย่างไรก็ตามหลังจากนั้น ความต้องการสำหรับดอลลาร์สหรัฐก็เริ่มลดลงอย่างรวดเร็ว
รูปแบบกราฟฟิก
ตัวบ่งชี้
เห็นบางอย่างรึเปล่า
คุณจะไม่เห็นมัน
InstaForex
บัญชี PAMM

Your IP address shows that you are currently located in the USA. If you are a resident of the United States, you are prohibited from using the services of InstaFintech Group including online trading, online transfers, deposit/withdrawal of funds, etc.
If you think you are seeing this message by mistake and your location is not the US, kindly proceed to the website. Otherwise, you must leave the website in order to comply with government restrictions.
Why does your IP address show your location as the USA?
Please confirm whether you are a US resident or not by clicking the relevant button below. If you choose the wrong option, being a US resident, you will not be able to open an account with InstaTrade anyway.
We are sorry for any inconvenience caused by this message.


