

Patrones actuales

Los patrones son modelos gráficos que se forman en el gráfico mediante el precio. Según uno de los postulados del análisis técnico, la historia (movimiento del precio) se repite. Esto quiere decir que los movimientos del precio a menudo son similares en las mismas situaciones que hacen posible pronosticar el futuro desarrollo de la situación con una alta probabilidad.
Los patrones relevantes de InstaTrade son un servicio fácil de utilizar que permiten que conozca los últimos cambios en el mercado y reaccione a las pistas del mercado a tiempo. En nuestro servicio, siempre encontrará los últimos y más importantes patrones en cualquier par y en cualquier marco de tiempo.
Double Bottom
was formed on 16.04 at 06:31:16 (UTC+0)
signal strength 2 of 5
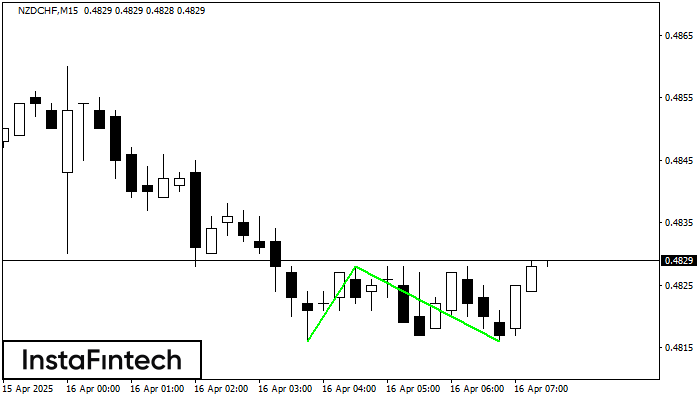
The Double Bottom pattern has been formed on NZDCHF M15; the upper boundary is 0.4828; the lower boundary is 0.4816. The width of the pattern is 12 points. In case of a break of the upper boundary 0.4828, a change in the trend can be predicted where the width of the pattern will coincide with the distance to a possible take profit level.
The M5 and M15 time frames may have more false entry points.
- All
- All
- Bearish Rectangle
- Bearish Symmetrical Triangle
- Bearish Symmetrical Triangle
- Bullish Rectangle
- Double Top
- Double Top
- Triple Bottom
- Triple Bottom
- Triple Top
- Triple Top
- All
- All
- Buy
- Sale
- All
- 1
- 2
- 3
- 4
- 5
Doble Techo
was formed on 02.05 at 14:30:24 (UTC+0)
signal strength 1 of 5
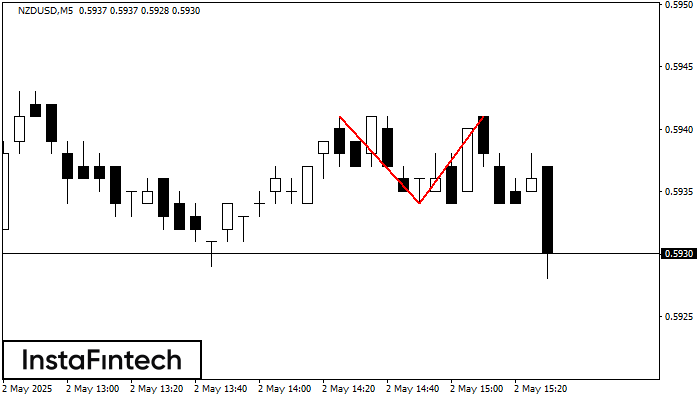
En el gráfico de NZDUSD M5 el patrón de reversión Doble Techo ha sido formado. Características: límite superior 0.5941; límite inferior 0.5934; el ancho del patrón 7 puntos. La señal
Los marcos de tiempo M5 y M15 pueden tener más puntos de entrada falsos.
Open chart in a new window
Doble Piso
was formed on 02.05 at 14:30:14 (UTC+0)
signal strength 2 of 5
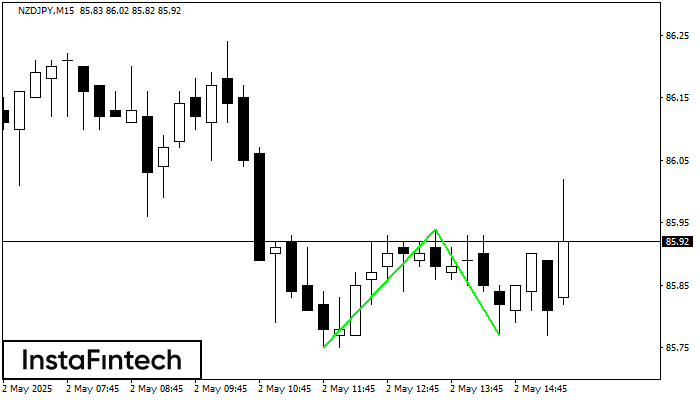
El patrón Doble Piso ha sido formado en NZDJPY M15. Esta formación señala una reversión de la tendencia de bajista a alcista. La señal es que se debe abrir
Los marcos de tiempo M5 y M15 pueden tener más puntos de entrada falsos.
Open chart in a new window
Cabeza y Hombros Inverso
was formed on 02.05 at 14:30:11 (UTC+0)
signal strength 2 of 5
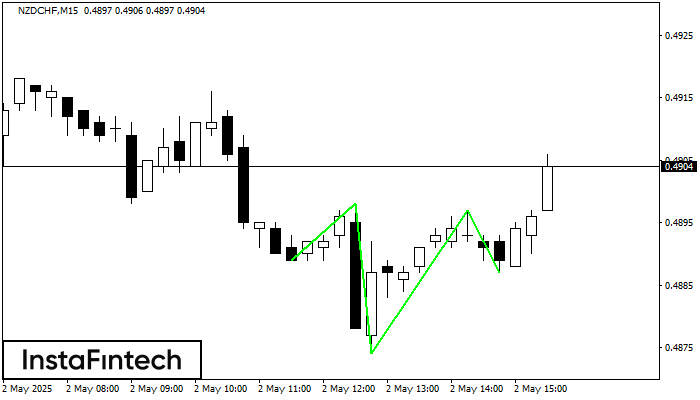
Según M15, NZDCHF está formando el patrón técnico: el Cabeza y Hombros Inverso. En caso de que la línea de cuello 0.4898/0.4897 se rompa, es posible que el instrumento
Los marcos de tiempo M5 y M15 pueden tener más puntos de entrada falsos.
Open chart in a new window


