

Patrones actuales

Los patrones son modelos gráficos que se forman en el gráfico mediante el precio. Según uno de los postulados del análisis técnico, la historia (movimiento del precio) se repite. Esto quiere decir que los movimientos del precio a menudo son similares en las mismas situaciones que hacen posible pronosticar el futuro desarrollo de la situación con una alta probabilidad.
Los patrones relevantes de InstaTrade son un servicio fácil de utilizar que permiten que conozca los últimos cambios en el mercado y reaccione a las pistas del mercado a tiempo. En nuestro servicio, siempre encontrará los últimos y más importantes patrones en cualquier par y en cualquier marco de tiempo.
Double Bottom
was formed on 03.04 at 13:24:54 (UTC+0)
signal strength 1 of 5
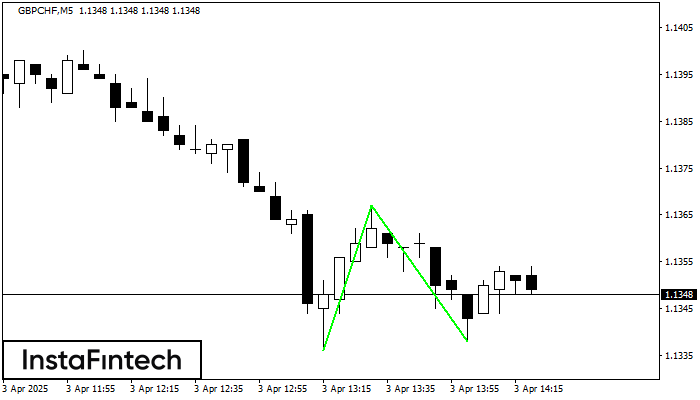
The Double Bottom pattern has been formed on GBPCHF M5. Characteristics: the support level 1.1336; the resistance level 1.1367; the width of the pattern 31 points. If the resistance level is broken, a change in the trend can be predicted with the first target point lying at the distance of 29 points.
The M5 and M15 time frames may have more false entry points.
Vea asimismo
- All
- All
- Bearish Rectangle
- Bearish Symmetrical Triangle
- Bearish Symmetrical Triangle
- Bullish Rectangle
- Double Top
- Double Top
- Triple Bottom
- Triple Bottom
- Triple Top
- Triple Top
- All
- All
- Buy
- Sale
- All
- 1
- 2
- 3
- 4
- 5
Bandera bajista
was formed on 11.04 at 08:37:39 (UTC+0)
signal strength 1 of 5
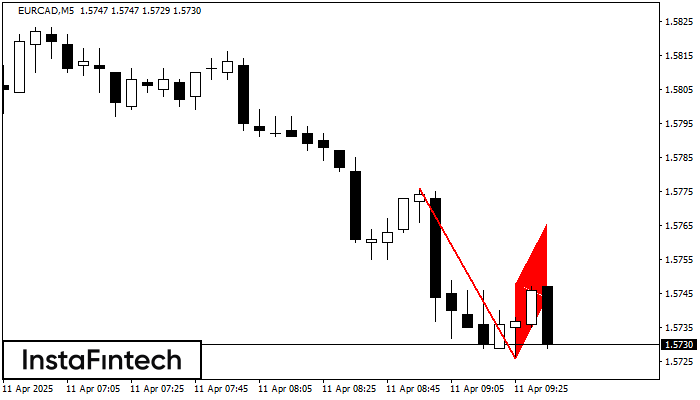
El patrón Bandera bajista ha sido formado en el gráfico EURCAD M5 que señala que la tendencia bajista continuará. Si el precio rompe por debajo del mínimo a 1.5726, entonces
Los marcos de tiempo M5 y M15 pueden tener más puntos de entrada falsos.
Open chart in a new window
Banderín bajista
was formed on 11.04 at 08:37:33 (UTC+0)
signal strength 1 of 5
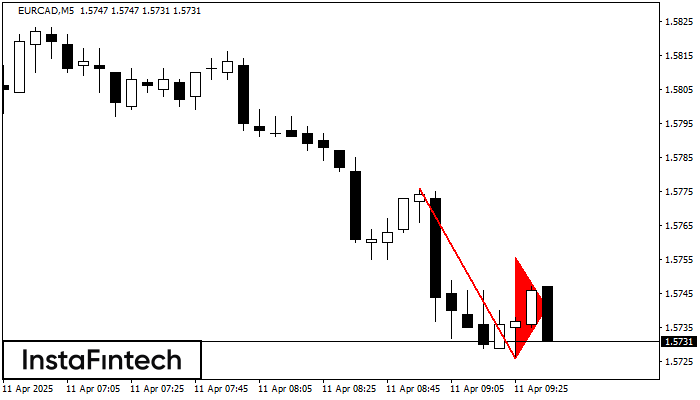
El patrón Banderín bajista se ha formado en el gráfico EURCAD M5. Este tipo de patrón se caracteriza por una ligera disminución después de lo cual el precio se moverá
Los marcos de tiempo M5 y M15 pueden tener más puntos de entrada falsos.
Open chart in a new window
Cabeza y Hombros Inverso
was formed on 11.04 at 08:30:14 (UTC+0)
signal strength 3 of 5
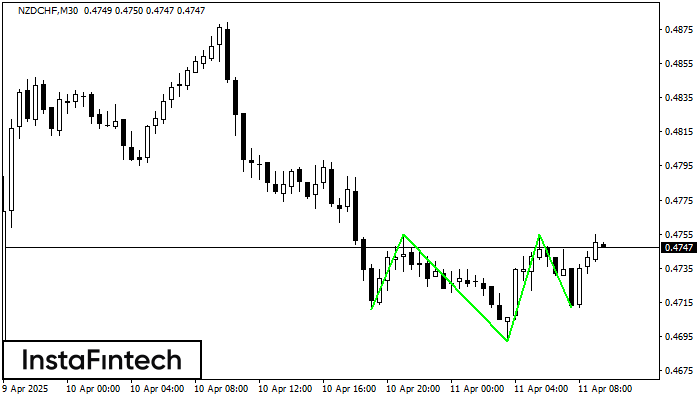
Según M30, NZDCHF está formando el patrón técnico: el Cabeza y Hombros Inverso. En caso de que la línea de cuello 0.4755/0.4755 se rompa, es posible que el instrumento
Open chart in a new window


