

Patrones actuales

Los patrones son modelos gráficos que se forman en el gráfico mediante el precio. Según uno de los postulados del análisis técnico, la historia (movimiento del precio) se repite. Esto quiere decir que los movimientos del precio a menudo son similares en las mismas situaciones que hacen posible pronosticar el futuro desarrollo de la situación con una alta probabilidad.
Los patrones relevantes de InstaTrade son un servicio fácil de utilizar que permiten que conozca los últimos cambios en el mercado y reaccione a las pistas del mercado a tiempo. En nuestro servicio, siempre encontrará los últimos y más importantes patrones en cualquier par y en cualquier marco de tiempo.
Triple Bottom
was formed on 02.04 at 20:05:06 (UTC+0)
signal strength 1 of 5
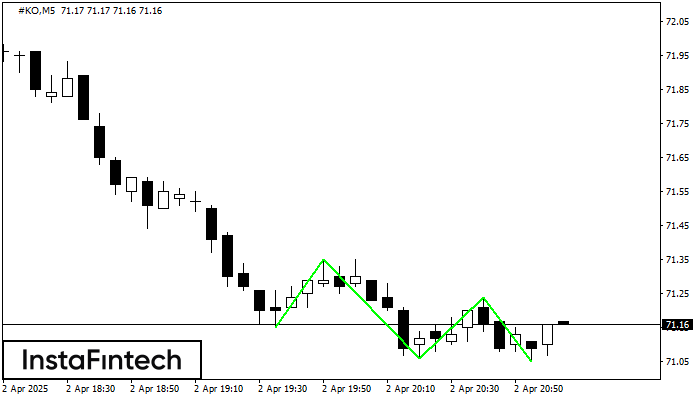
The Triple Bottom pattern has been formed on #KO M5. It has the following characteristics: resistance level 71.35/71.24; support level 71.15/71.05; the width is 20 points. In the event of a breakdown of the resistance level of 71.35, the price is likely to continue an upward movement at least to 71.21.
The M5 and M15 time frames may have more false entry points.
- All
- All
- Bearish Rectangle
- Bearish Symmetrical Triangle
- Bearish Symmetrical Triangle
- Bullish Rectangle
- Double Top
- Double Top
- Triple Bottom
- Triple Bottom
- Triple Top
- Triple Top
- All
- All
- Buy
- Sale
- All
- 1
- 2
- 3
- 4
- 5
Bullish Rectangle
was formed on 02.05 at 16:26:31 (UTC+0)
signal strength 1 of 5
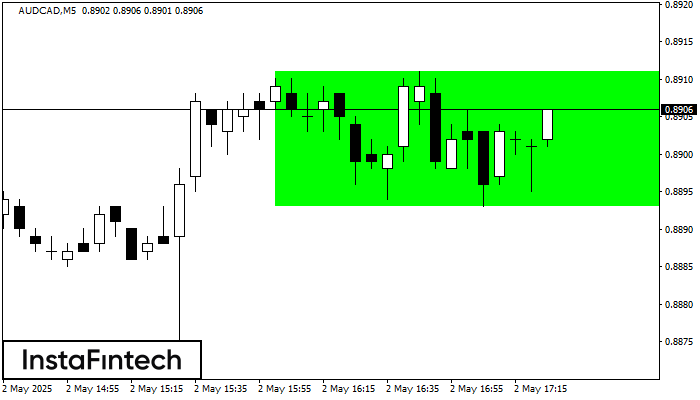
According to the chart of M5, AUDCAD formed the Bullish Rectangle. This type of a pattern indicates a trend continuation. It consists of two levels: resistance 0.8911 and support 0.8893
The M5 and M15 time frames may have more false entry points.
Open chart in a new window
Double Top
was formed on 02.05 at 16:05:28 (UTC+0)
signal strength 1 of 5
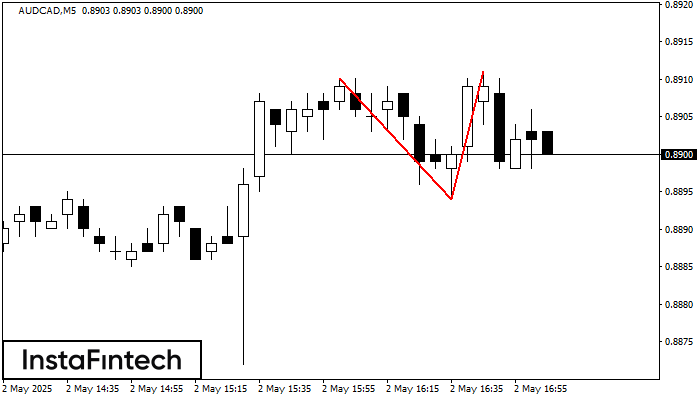
On the chart of AUDCAD M5 the Double Top reversal pattern has been formed. Characteristics: the upper boundary 0.8911; the lower boundary 0.8894; the width of the pattern 17 points
The M5 and M15 time frames may have more false entry points.
Open chart in a new window
Head and Shoulders
was formed on 02.05 at 15:40:20 (UTC+0)
signal strength 1 of 5
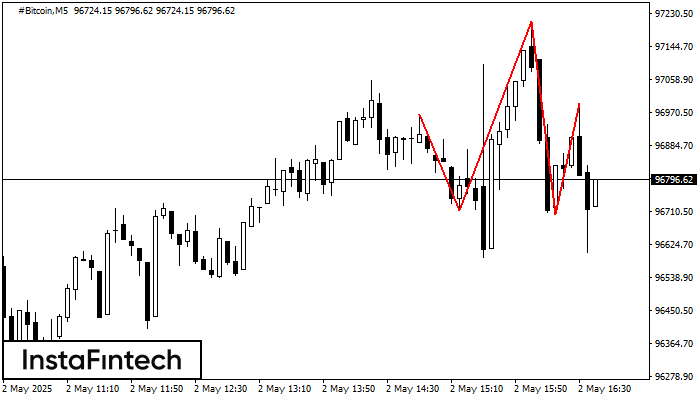
The technical pattern called Head and Shoulders has appeared on the chart of #Bitcoin M5. There are weighty reasons to suggest that the price will surpass the Neckline 96714.23/96704.41 after
The M5 and M15 time frames may have more false entry points.
Open chart in a new window


