

Patrones actuales

Los patrones son modelos gráficos que se forman en el gráfico mediante el precio. Según uno de los postulados del análisis técnico, la historia (movimiento del precio) se repite. Esto quiere decir que los movimientos del precio a menudo son similares en las mismas situaciones que hacen posible pronosticar el futuro desarrollo de la situación con una alta probabilidad.
Los patrones relevantes de InstaTrade son un servicio fácil de utilizar que permiten que conozca los últimos cambios en el mercado y reaccione a las pistas del mercado a tiempo. En nuestro servicio, siempre encontrará los últimos y más importantes patrones en cualquier par y en cualquier marco de tiempo.
Bearish Rectangle
was formed on 28.03 at 06:01:22 (UTC+0)
signal strength 1 of 5
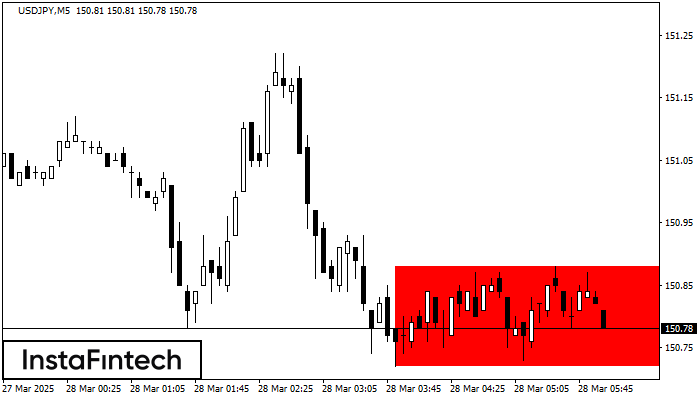
According to the chart of M5, USDJPY formed the Bearish Rectangle. This type of a pattern indicates a trend continuation. It consists of two levels: resistance 150.88 - 0.00 and support 150.72 – 150.72. In case the resistance level 150.72 - 150.72 is broken, the instrument is likely to follow the bearish trend.
The M5 and M15 time frames may have more false entry points.
- All
- All
- Bearish Rectangle
- Bearish Symmetrical Triangle
- Bearish Symmetrical Triangle
- Bullish Rectangle
- Double Top
- Double Top
- Triple Bottom
- Triple Bottom
- Triple Top
- Triple Top
- All
- All
- Buy
- Sale
- All
- 1
- 2
- 3
- 4
- 5
Fundo duplo
was formed on 03.05 at 10:45:44 (UTC+0)
signal strength 2 of 5

O padrão Fundo duplo foi formado em #Bitcoin M15. Esta formação sinaliza uma reversão da tendência de baixo para cima. O sinal é que uma negociação de compra deve
Os intervalos M5 e M15 podem ter mais pontos de entrada falsos.
Open chart in a new window
Fundo duplo
was formed on 03.05 at 08:00:01 (UTC+0)
signal strength 3 of 5

O padrão Fundo duplo foi formado em #Bitcoin M30; o limite superior é 97860.25; o limite inferior é 96258.44. A largura do padrão é de 156618 pontos. No caso
Open chart in a new window
Fundo duplo
was formed on 03.05 at 06:20:09 (UTC+0)
signal strength 1 of 5

O padrão Fundo duplo foi formado em #Bitcoin M5; o limite superior é 96467.62; o limite inferior é 96258.44. A largura do padrão é de 20692 pontos. No caso
Os intervalos M5 e M15 podem ter mais pontos de entrada falsos.
Open chart in a new window


