

Patrones actuales

Los patrones son modelos gráficos que se forman en el gráfico mediante el precio. Según uno de los postulados del análisis técnico, la historia (movimiento del precio) se repite. Esto quiere decir que los movimientos del precio a menudo son similares en las mismas situaciones que hacen posible pronosticar el futuro desarrollo de la situación con una alta probabilidad.
Los patrones relevantes de InstaTrade son un servicio fácil de utilizar que permiten que conozca los últimos cambios en el mercado y reaccione a las pistas del mercado a tiempo. En nuestro servicio, siempre encontrará los últimos y más importantes patrones en cualquier par y en cualquier marco de tiempo.
Inverse Head and Shoulder
was formed on 27.03 at 03:05:48 (UTC+0)
signal strength 1 of 5

According to the chart of M5, NZDUSD formed the Inverse Head and Shoulder pattern. The Head’s top is set at 0.5723 while the median line of the Neck is found at 0.5705/0.5719. The formation of the Inverse Head and Shoulder pattern evidently signals a reversal of the downward trend. In other words, in case the scenario comes true, the price of NZDUSD will go towards 0.5738
The M5 and M15 time frames may have more false entry points.
- All
- All
- Bearish Rectangle
- Bearish Symmetrical Triangle
- Bearish Symmetrical Triangle
- Bullish Rectangle
- Double Top
- Double Top
- Triple Bottom
- Triple Bottom
- Triple Top
- Triple Top
- All
- All
- Buy
- Sale
- All
- 1
- 2
- 3
- 4
- 5
डबल बॉटम
was formed on 11.04 at 12:00:06 (UTC+0)
signal strength 1 of 5
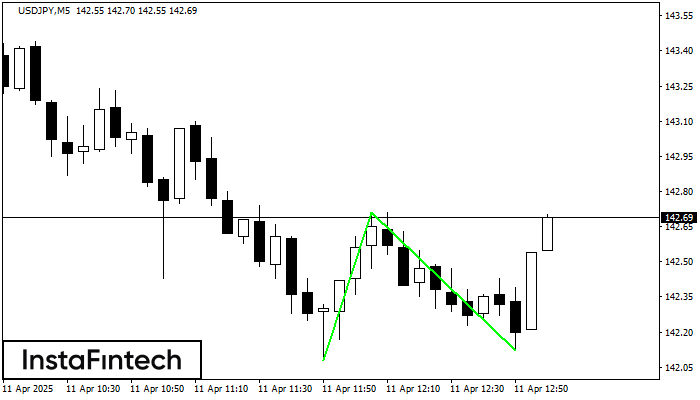
डबल बॉटम पैटर्न USDJPY M5 पर बना है। विशेषताएं: समर्थन स्तर 142.08; प्रतिरोध स्तर 142.71; पैटर्न की चौड़ाई 63 पॉइंट्स। यदि प्रतिरोध स्तर टूट जाता है, तो रुझान में बदलाव
M5 और M15 समय सीमा में अधिक फाल्स एंट्री पॉइंट्स हो सकते हैं।
Open chart in a new window
डबल बॉटम
was formed on 11.04 at 11:59:58 (UTC+0)
signal strength 3 of 5
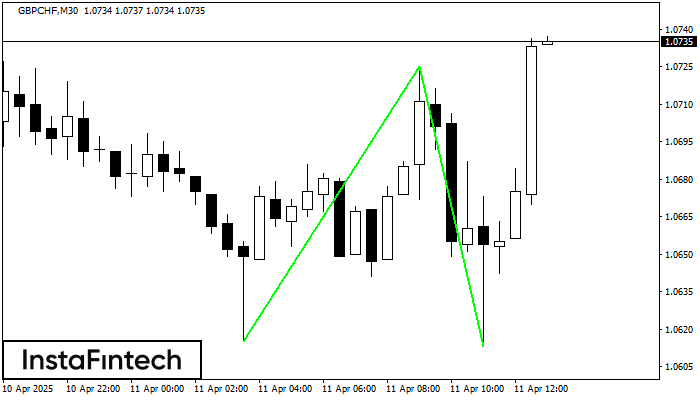
डबल बॉटम पैटर्न GBPCHF M30 पर बना है; ऊपरी सीमा 1.0725 है; निचली सीमा 1.0613 है। पैटर्न की चौड़ाई 110 अंक है। ऊपरी सीमा 1.0725 के टूटने के मामले में
Open chart in a new window
डबल बॉटम
was formed on 11.04 at 11:59:54 (UTC+0)
signal strength 4 of 5
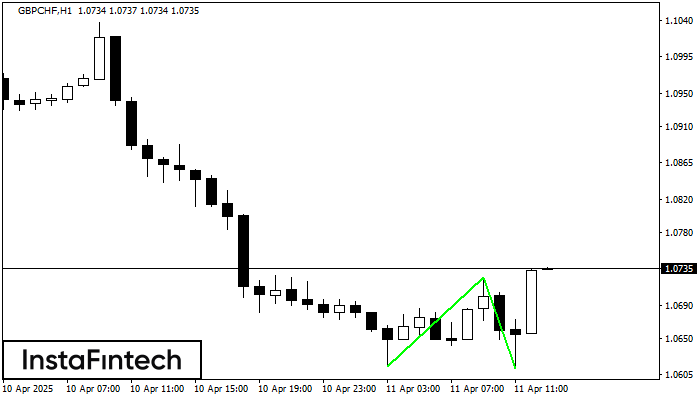
डबल बॉटम पैटर्न GBPCHF H1 पर बना है; ऊपरी सीमा 1.0725 है; निचली सीमा 1.0613 है। पैटर्न की चौड़ाई 110 अंक है। ऊपरी सीमा 1.0725 के टूटने के मामले में
Open chart in a new window


