

Actual patterns

Patterns are graphical models which are formed in the chart by the price. According to one of the technical analysis postulates, history (price movement) repeats itself. It means that the price movements are often similar in the same situations which makes it possible to predict the further development of the situation with a high probability.
Relevant patterns by InstaTrade is an easy-to-use service which allows you to be aware of latest changes in the market and react to clues from the market in time. In our service you will always find the latest and most relevant patterns on any pair and any timeframe.
Bearish pennant
was formed on 31.03 at 16:30:30 (UTC+0)
signal strength 2 of 5
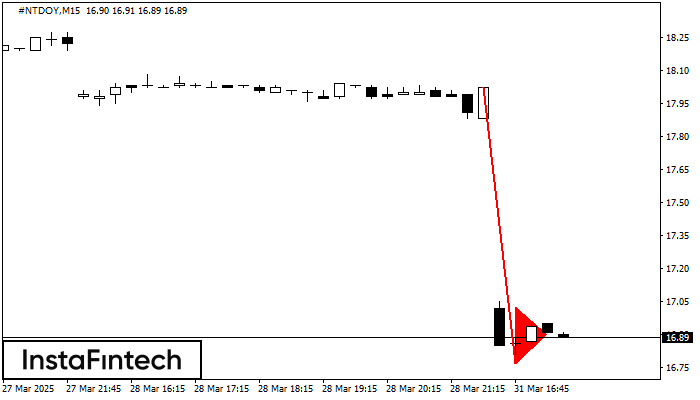
The Bearish pennant pattern has formed on the #NTDOY M15 chart. This pattern type is characterized by a slight slowdown after which the price will move in the direction of the original trend. In case the price fixes below the pattern’s low of 16.77, a trader will be able to successfully enter the sell position.
The M5 and M15 time frames may have more false entry points.
- All
- All
- Bearish Rectangle
- Bearish Symmetrical Triangle
- Bearish Symmetrical Triangle
- Bullish Rectangle
- Double Top
- Double Top
- Triple Bottom
- Triple Bottom
- Triple Top
- Triple Top
- All
- All
- Buy
- Sale
- All
- 1
- 2
- 3
- 4
- 5
Đỉnh ba
was formed on 27.05 at 21:20:19 (UTC+0)
signal strength 1 of 5
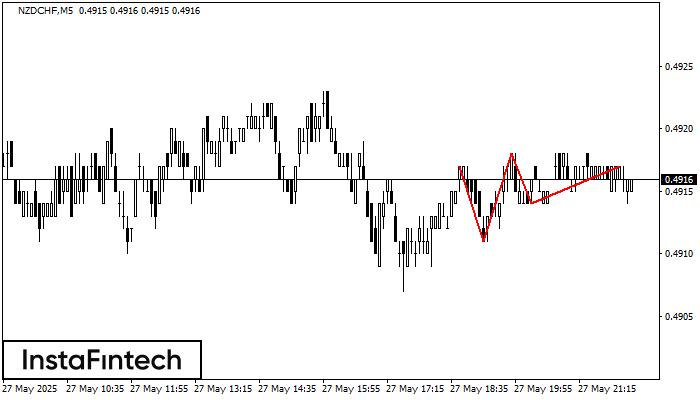
Trên biểu đồ của công cụ giao dịch NZDCHF M5, mô hình Đỉnh ba báo hiệu sự thay đổi xu hướng đã hình thành. Có thể sau khi hình thành
Khung thời gian M5 và M15 có thể có nhiều điểm vào lệnh sai hơn.
Open chart in a new window
Đỉnh ba
was formed on 27.05 at 21:00:16 (UTC+0)
signal strength 2 of 5
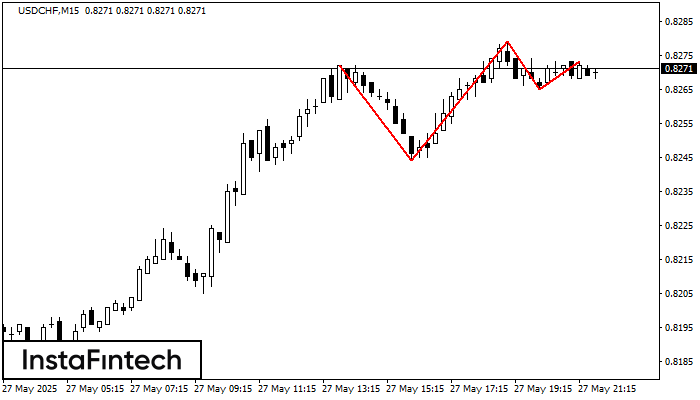
Trên biểu đồ của công cụ giao dịch USDCHF M15, mô hình Đỉnh ba báo hiệu sự thay đổi xu hướng đã hình thành. Có thể sau khi hình thành
Khung thời gian M5 và M15 có thể có nhiều điểm vào lệnh sai hơn.
Open chart in a new window
Tam giác Cân Tăng
was formed on 27.05 at 20:36:16 (UTC+0)
signal strength 1 of 5
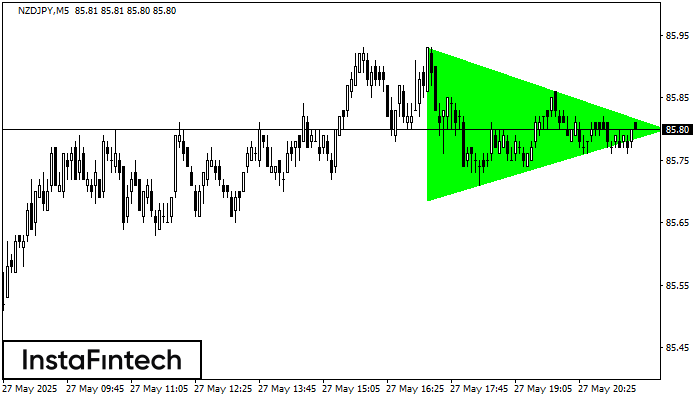
Theo biểu đồ của M5, NZDJPY đã hình thành mô hình Tam giác Cân Tăng. Đường biên giới thấp hơn của mô hình chạm tọa độ 85.68/85.80 trong khi đường
Khung thời gian M5 và M15 có thể có nhiều điểm vào lệnh sai hơn.
Open chart in a new window


