Актуальные паттерны

Паттерны – это графические модели, которые "рисует" цена на графике. Один из постулатов технического анализа говорит нам о том, что история (движение цены) всегда повторяется. Это значит, что в похожих ситуациях движение цены, зачастую, будет похожим, что позволяет с высокой долей вероятности спрогнозировать дальнейшее развитие ситуации.
Актуальные паттерны от ИнстаФорекс – это удобный сервис, который позволит вам всегда быть в курсе последних изменений на рынке и вовремя реагировать на появившиеся подсказки от рынка. В нашем сервисе вы всегда найдете самые свежие и актуальные паттерны на любой паре и на любом таймфрейме.
Двойное дно
сформирован 14.04 в 22:00:04 (UTC+0)
сила сигнала 1 из 5
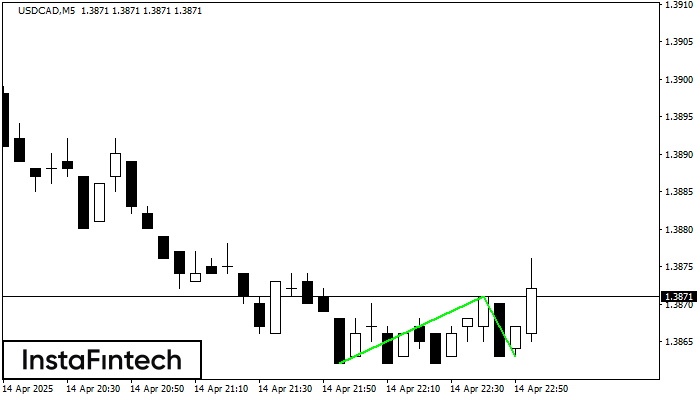
Сформирована фигура «Двойное дно» на графике USDCAD M5. Характеристика: Уровень поддержки 1.3862; Уровень сопротивления 1.3871; Ширина фигуры 9 пунктов. В случае пробоя уровня сопротивления можно будет прогнозировать изменение тенденции, где первая точка фиксации прибыли находится на расстоянии 8 пунктов.
Таймфреймы М5 и М15 могут иметь больше ложных точек входа.
Смотрите также
- Все
- Все
- Bearish Rectangle
- Bearish Symmetrical Triangle
- Bearish Symmetrical Triangle
- Bullish Rectangle
- Double Top
- Double Top
- Triple Bottom
- Triple Bottom
- Triple Top
- Triple Top
- Все
- Все
- Покупка
- Продажа
- Все
- 1
- 2
- 3
- 4
- 5
Double Bottom
was formed on 29.05 at 15:00:17 (UTC+0)
signal strength 2 of 5
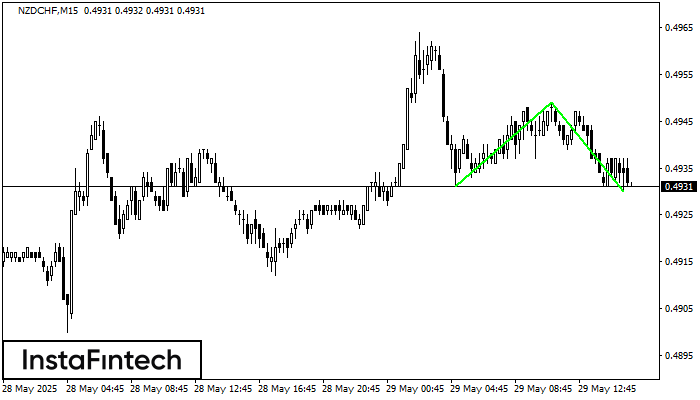
The Double Bottom pattern has been formed on NZDCHF M15; the upper boundary is 0.4949; the lower boundary is 0.4930. The width of the pattern is 18 points. In case
The M5 and M15 time frames may have more false entry points.
Open chart in a new window
Bearish Rectangle
was formed on 29.05 at 14:04:55 (UTC+0)
signal strength 2 of 5
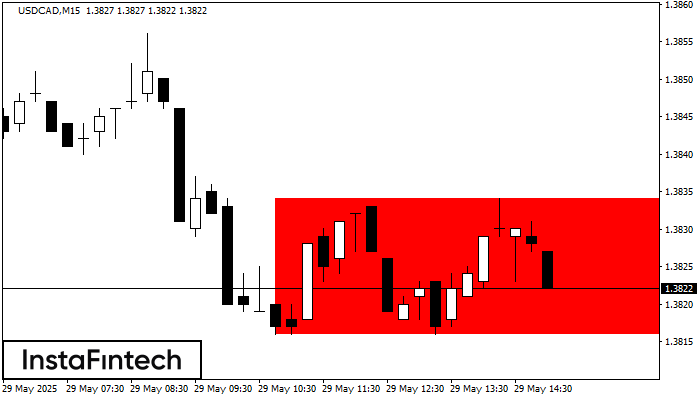
According to the chart of M15, USDCAD formed the Bearish Rectangle. The pattern indicates a trend continuation. The upper border is 1.3834, the lower border is 1.3816. The signal means
The M5 and M15 time frames may have more false entry points.
Open chart in a new window
Bearish Rectangle
was formed on 29.05 at 13:36:16 (UTC+0)
signal strength 1 of 5
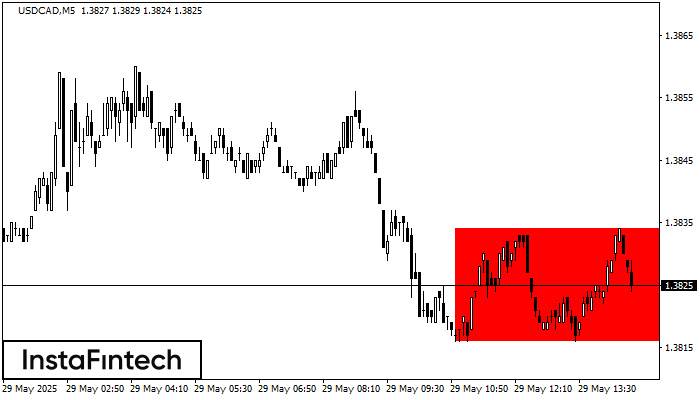
According to the chart of M5, USDCAD formed the Bearish Rectangle which is a pattern of a trend continuation. The pattern is contained within the following borders: lower border 1.3816
The M5 and M15 time frames may have more false entry points.
Open chart in a new window