Актуальные паттерны

Паттерны – это графические модели, которые "рисует" цена на графике. Один из постулатов технического анализа говорит нам о том, что история (движение цены) всегда повторяется. Это значит, что в похожих ситуациях движение цены, зачастую, будет похожим, что позволяет с высокой долей вероятности спрогнозировать дальнейшее развитие ситуации.
Актуальные паттерны от ИнстаФорекс – это удобный сервис, который позволит вам всегда быть в курсе последних изменений на рынке и вовремя реагировать на появившиеся подсказки от рынка. В нашем сервисе вы всегда найдете самые свежие и актуальные паттерны на любой паре и на любом таймфрейме.
Медвежий симметричный треугольник
сформирован 07.04 в 22:29:21 (UTC+0)
сила сигнала 1 из 5
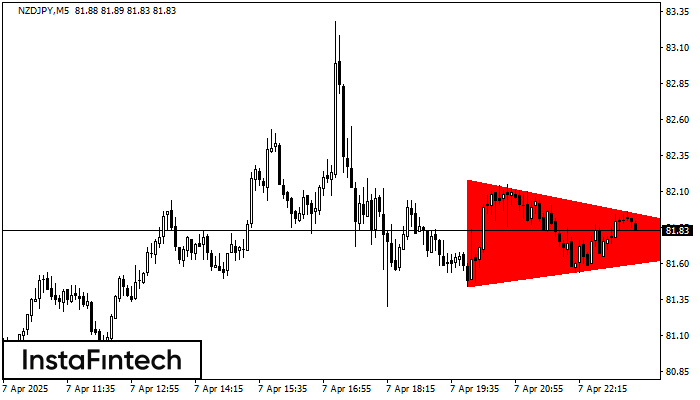
По NZDJPY M5 сформировалась фигура «Медвежий симметричный треугольник». Данная фигура сигнализирует нам о продолжении нисходящего тренда в случае пробоя нижней границы 81.44, где вероятная прибыль будет являться шириной текущей фигуры -75 пунктов.
Таймфреймы М5 и М15 могут иметь больше ложных точек входа.
- Все
- Все
- Bearish Rectangle
- Bearish Symmetrical Triangle
- Bearish Symmetrical Triangle
- Bullish Rectangle
- Double Top
- Double Top
- Triple Bottom
- Triple Bottom
- Triple Top
- Triple Top
- Все
- Все
- Покупка
- Продажа
- Все
- 1
- 2
- 3
- 4
- 5
Triple Bottom
was formed on 25.04 at 11:34:47 (UTC+0)
signal strength 1 of 5
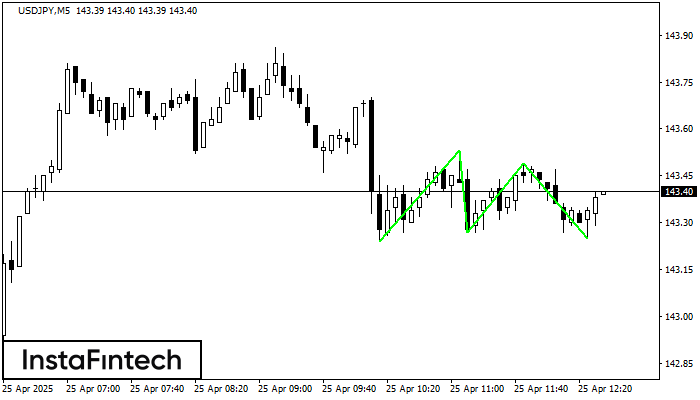
The Triple Bottom pattern has been formed on USDJPY M5. It has the following characteristics: resistance level 143.53/143.49; support level 143.24/143.25; the width is 29 points. In the event
The M5 and M15 time frames may have more false entry points.
Open chart in a new window
Head and Shoulders
was formed on 25.04 at 11:16:23 (UTC+0)
signal strength 2 of 5

The technical pattern called Head and Shoulders has appeared on the chart of USDCHF M15. There are weighty reasons to suggest that the price will surpass the Neckline 0.8293/0.8295 after
The M5 and M15 time frames may have more false entry points.
Open chart in a new window
Double Bottom
was formed on 25.04 at 11:00:37 (UTC+0)
signal strength 1 of 5
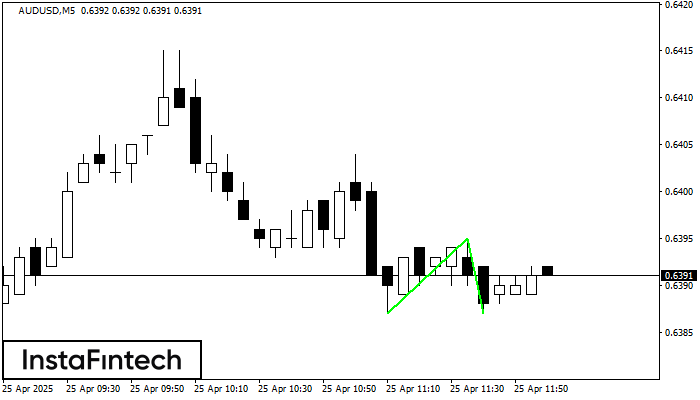
The Double Bottom pattern has been formed on AUDUSD M5. This formation signals a reversal of the trend from downwards to upwards. The signal is that a buy trade should
The M5 and M15 time frames may have more false entry points.
Open chart in a new window