Актуальные паттерны

Паттерны – это графические модели, которые "рисует" цена на графике. Один из постулатов технического анализа говорит нам о том, что история (движение цены) всегда повторяется. Это значит, что в похожих ситуациях движение цены, зачастую, будет похожим, что позволяет с высокой долей вероятности спрогнозировать дальнейшее развитие ситуации.
Актуальные паттерны от ИнстаФорекс – это удобный сервис, который позволит вам всегда быть в курсе последних изменений на рынке и вовремя реагировать на появившиеся подсказки от рынка. В нашем сервисе вы всегда найдете самые свежие и актуальные паттерны на любой паре и на любом таймфрейме.
Двойное дно
сформирован 07.04 в 21:20:40 (UTC+0)
сила сигнала 1 из 5
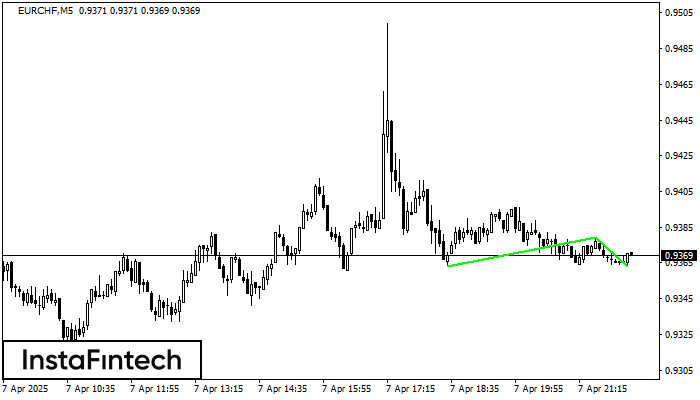
Сформирована фигура «Двойное дно» на графике EURCHF M5. Верхняя граница 0.9379; Нижняя граница 0.9363; Ширина фигуры 16 пунктов. В случае пробоя верхней границы 0.9379 можно будет прогнозировать изменение тенденции, где ширина фигуры и будет являться расстоянием предположительного Тейк Профита.
Таймфреймы М5 и М15 могут иметь больше ложных точек входа.
- Все
- Все
- Bearish Rectangle
- Bearish Symmetrical Triangle
- Bearish Symmetrical Triangle
- Bullish Rectangle
- Double Top
- Double Top
- Triple Bottom
- Triple Bottom
- Triple Top
- Triple Top
- Все
- Все
- Покупка
- Продажа
- Все
- 1
- 2
- 3
- 4
- 5
Inverse Head and Shoulder
was formed on 11.06 at 05:40:20 (UTC+0)
signal strength 1 of 5
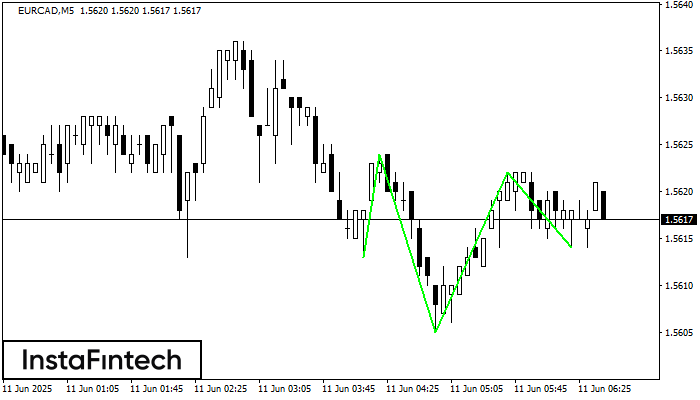
According to the chart of M5, EURCAD formed the Inverse Head and Shoulder pattern. The Head’s top is set at 1.5622 while the median line of the Neck is found
The M5 and M15 time frames may have more false entry points.
Open chart in a new window
Bearish Rectangle
was formed on 11.06 at 05:40:01 (UTC+0)
signal strength 1 of 5
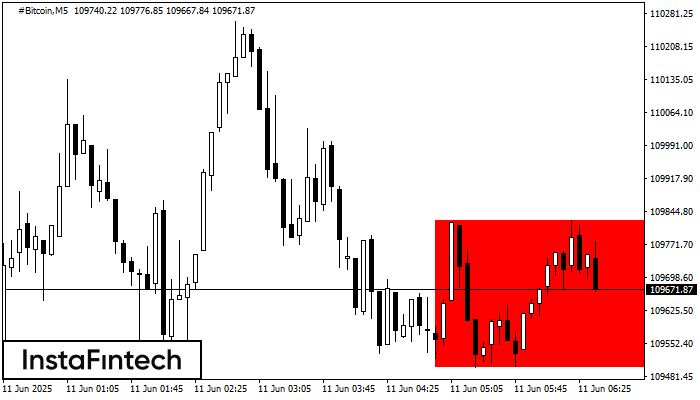
According to the chart of M5, #Bitcoin formed the Bearish Rectangle which is a pattern of a trend continuation. The pattern is contained within the following borders: lower border 109500.22
The M5 and M15 time frames may have more false entry points.
Open chart in a new window
Triple Bottom
was formed on 11.06 at 05:00:31 (UTC+0)
signal strength 1 of 5
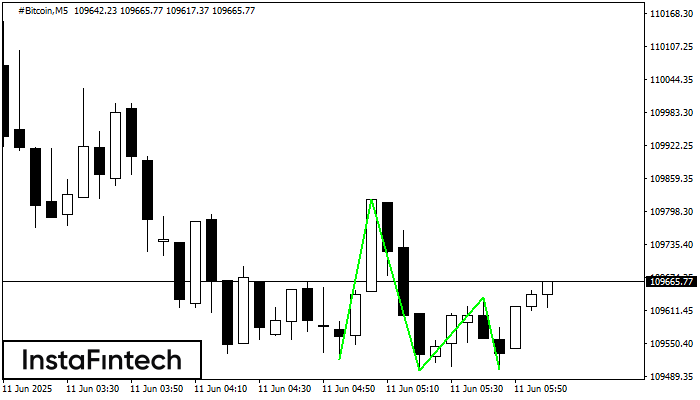
The Triple Bottom pattern has been formed on #Bitcoin M5. It has the following characteristics: resistance level 109821.12/109636.18; support level 109521.27/109502.23; the width is 29985 points. In the event
The M5 and M15 time frames may have more false entry points.
Open chart in a new window