Актуальные паттерны

Паттерны – это графические модели, которые "рисует" цена на графике. Один из постулатов технического анализа говорит нам о том, что история (движение цены) всегда повторяется. Это значит, что в похожих ситуациях движение цены, зачастую, будет похожим, что позволяет с высокой долей вероятности спрогнозировать дальнейшее развитие ситуации.
Актуальные паттерны от ИнстаФорекс – это удобный сервис, который позволит вам всегда быть в курсе последних изменений на рынке и вовремя реагировать на появившиеся подсказки от рынка. В нашем сервисе вы всегда найдете самые свежие и актуальные паттерны на любой паре и на любом таймфрейме.
Голова и плечи
сформирован 07.04 в 15:29:59 (UTC+0)
сила сигнала 1 из 5

На графике USDCAD M5 сформировалась фигура «Голова и плечи» с характеристикой: Вершина головы 1.4295; Уровень шеи, восходящий угол - 1.4237/1.4245. Формирование данной фигуры может привести к изменению текущей тенденции с восходящей на нисходящую. Вероятно предполагать, что курс USDCAD, в случае срабатывания фигуры, пойдет в направлении 1.4230 (10 - 20 пунктов).
Таймфреймы М5 и М15 могут иметь больше ложных точек входа.
- Все
- Все
- Bearish Rectangle
- Bearish Symmetrical Triangle
- Bearish Symmetrical Triangle
- Bullish Rectangle
- Double Top
- Double Top
- Triple Bottom
- Triple Bottom
- Triple Top
- Triple Top
- Все
- Все
- Покупка
- Продажа
- Все
- 1
- 2
- 3
- 4
- 5
Double Bottom
was formed on 02.06 at 09:00:13 (UTC+0)
signal strength 3 of 5

The Double Bottom pattern has been formed on GBPJPY M30. Characteristics: the support level 193.37; the resistance level 194.63; the width of the pattern 126 points. If the resistance level
Open chart in a new window
Double Bottom
was formed on 02.06 at 09:00:05 (UTC+0)
signal strength 4 of 5
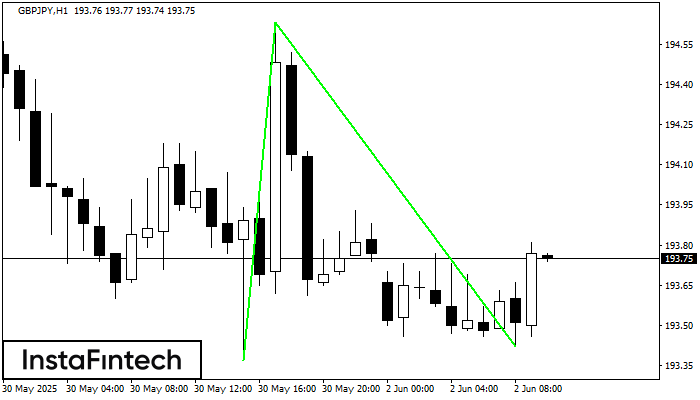
The Double Bottom pattern has been formed on GBPJPY H1. This formation signals a reversal of the trend from downwards to upwards. The signal is that a buy trade should
Open chart in a new window
Double Bottom
was formed on 02.06 at 08:44:59 (UTC+0)
signal strength 2 of 5
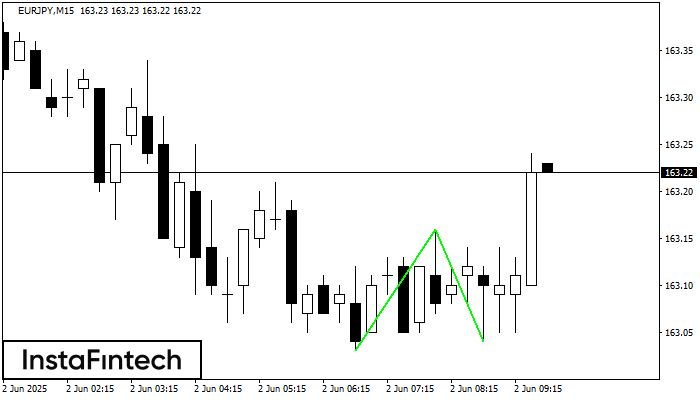
The Double Bottom pattern has been formed on EURJPY M15; the upper boundary is 163.16; the lower boundary is 163.04. The width of the pattern is 13 points. In case
The M5 and M15 time frames may have more false entry points.
Open chart in a new window