Актуальные паттерны

Паттерны – это графические модели, которые "рисует" цена на графике. Один из постулатов технического анализа говорит нам о том, что история (движение цены) всегда повторяется. Это значит, что в похожих ситуациях движение цены, зачастую, будет похожим, что позволяет с высокой долей вероятности спрогнозировать дальнейшее развитие ситуации.
Актуальные паттерны от ИнстаФорекс – это удобный сервис, который позволит вам всегда быть в курсе последних изменений на рынке и вовремя реагировать на появившиеся подсказки от рынка. В нашем сервисе вы всегда найдете самые свежие и актуальные паттерны на любой паре и на любом таймфрейме.
Двойное дно
сформирован 06.04 в 23:30:08 (UTC+0)
сила сигнала 2 из 5
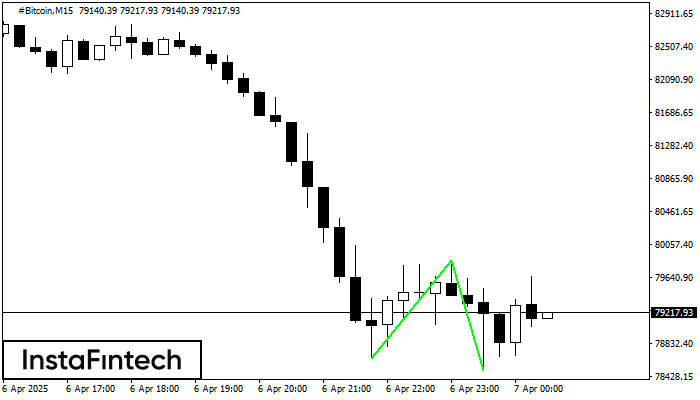
Сформирована фигура «Двойное дно» на графике #Bitcoin M15. Данное формирование сигнализирует об изменении тенденции с нисходящего на восходящее движение. Сигнал: Торговую позицию на покупку следует открывать после пробоя верхней границы фигуры 79853.21, где перспектива будущего хода будет являться шириной текущей фигуры - 121369 пунктов.
Таймфреймы М5 и М15 могут иметь больше ложных точек входа.
Смотрите также
- Все
- Все
- Bearish Rectangle
- Bearish Symmetrical Triangle
- Bearish Symmetrical Triangle
- Bullish Rectangle
- Double Top
- Double Top
- Triple Bottom
- Triple Bottom
- Triple Top
- Triple Top
- Все
- Все
- Покупка
- Продажа
- Все
- 1
- 2
- 3
- 4
- 5
Bearish pennant
сформирован 02.06 в 09:40:38 (UTC+0)
сила сигнала 1 из 5
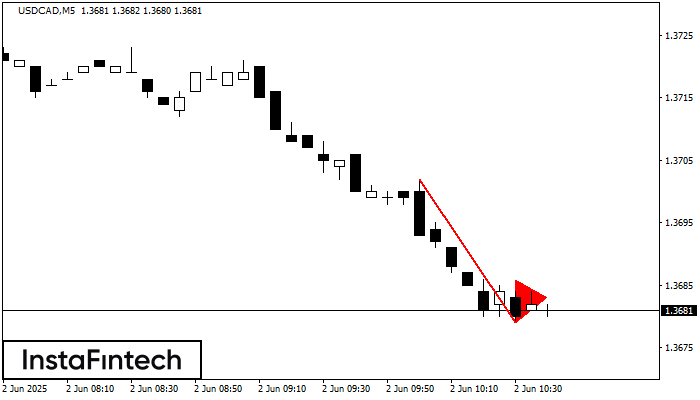
The Bearish pennant pattern has formed on the USDCAD M5 chart. It signals potential continuation of the existing trend. Specifications: the pattern’s bottom has the coordinate of 1.3679; the projection
The M5 and M15 time frames may have more false entry points.
Открыть график инструмента в новом окне
Bullish Symmetrical Triangle
сформирован 02.06 в 09:22:12 (UTC+0)
сила сигнала 4 из 5

According to the chart of H1, EURJPY formed the Bullish Symmetrical Triangle pattern. The lower border of the pattern touches the coordinates 162.28/163.37 whereas the upper border goes across 164.23/163.37
Открыть график инструмента в новом окне
Double Bottom
сформирован 02.06 в 09:00:13 (UTC+0)
сила сигнала 3 из 5

The Double Bottom pattern has been formed on GBPJPY M30. Characteristics: the support level 193.37; the resistance level 194.63; the width of the pattern 126 points. If the resistance level
Открыть график инструмента в новом окне