Актуальные паттерны

Паттерны – это графические модели, которые "рисует" цена на графике. Один из постулатов технического анализа говорит нам о том, что история (движение цены) всегда повторяется. Это значит, что в похожих ситуациях движение цены, зачастую, будет похожим, что позволяет с высокой долей вероятности спрогнозировать дальнейшее развитие ситуации.
Актуальные паттерны от ИнстаФорекс – это удобный сервис, который позволит вам всегда быть в курсе последних изменений на рынке и вовремя реагировать на появившиеся подсказки от рынка. В нашем сервисе вы всегда найдете самые свежие и актуальные паттерны на любой паре и на любом таймфрейме.
Двойная вершина
сформирован 27.03 в 05:23:08 (UTC+0)
сила сигнала 1 из 5
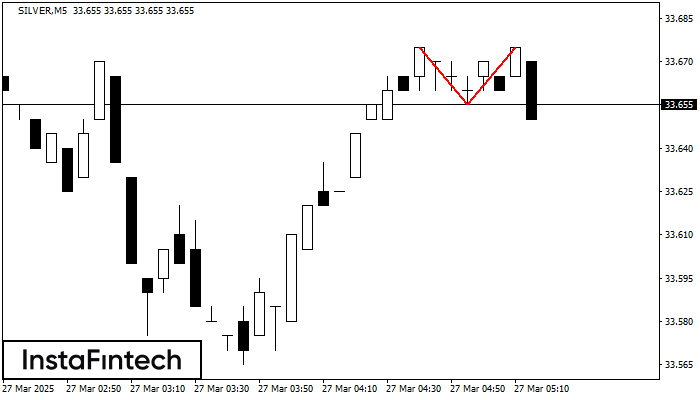
По SILVER на M5 сформировалась разворотная фигура «Двойная вершина». Характеристика: Верхняя граница 33.67; Нижняя граница 33.66; Ширина фигуры 20 пунктов. Позицию на продажу возможно открыть ниже нижней границы 33.66, с перспективой хода к уровню 33.64.
Таймфреймы М5 и М15 могут иметь больше ложных точек входа.
- Все
- Все
- Bearish Rectangle
- Bearish Symmetrical Triangle
- Bearish Symmetrical Triangle
- Bullish Rectangle
- Double Top
- Double Top
- Triple Bottom
- Triple Bottom
- Triple Top
- Triple Top
- Все
- Все
- Покупка
- Продажа
- Все
- 1
- 2
- 3
- 4
- 5
Bullish Rectangle
was formed on 13.06 at 11:00:28 (UTC+0)
signal strength 1 of 5
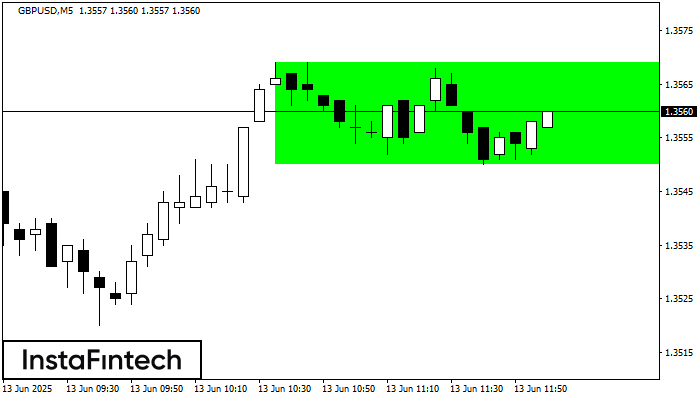
According to the chart of M5, GBPUSD formed the Bullish Rectangle. This type of a pattern indicates a trend continuation. It consists of two levels: resistance 1.3569 and support 1.3550
The M5 and M15 time frames may have more false entry points.
Open chart in a new window
Double Bottom
was formed on 13.06 at 10:15:43 (UTC+0)
signal strength 2 of 5
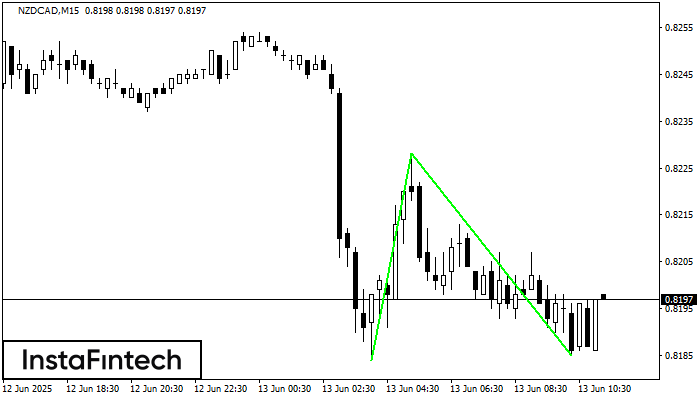
The Double Bottom pattern has been formed on NZDCAD M15. This formation signals a reversal of the trend from downwards to upwards. The signal is that a buy trade should
The M5 and M15 time frames may have more false entry points.
Open chart in a new window
Triple Bottom
was formed on 13.06 at 09:45:15 (UTC+0)
signal strength 2 of 5
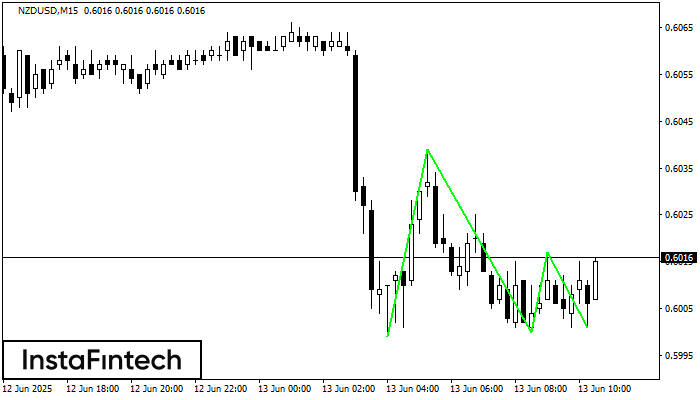
The Triple Bottom pattern has been formed on NZDUSD M15. It has the following characteristics: resistance level 0.6039/0.6017; support level 0.5999/0.6001; the width is 40 points. In the event
The M5 and M15 time frames may have more false entry points.
Open chart in a new window