Актуальные паттерны

Паттерны – это графические модели, которые "рисует" цена на графике. Один из постулатов технического анализа говорит нам о том, что история (движение цены) всегда повторяется. Это значит, что в похожих ситуациях движение цены, зачастую, будет похожим, что позволяет с высокой долей вероятности спрогнозировать дальнейшее развитие ситуации.
Актуальные паттерны от ИнстаФорекс – это удобный сервис, который позволит вам всегда быть в курсе последних изменений на рынке и вовремя реагировать на появившиеся подсказки от рынка. В нашем сервисе вы всегда найдете самые свежие и актуальные паттерны на любой паре и на любом таймфрейме.
Двойная вершина
сформирован 26.03 в 04:16:03 (UTC+0)
сила сигнала 1 из 5
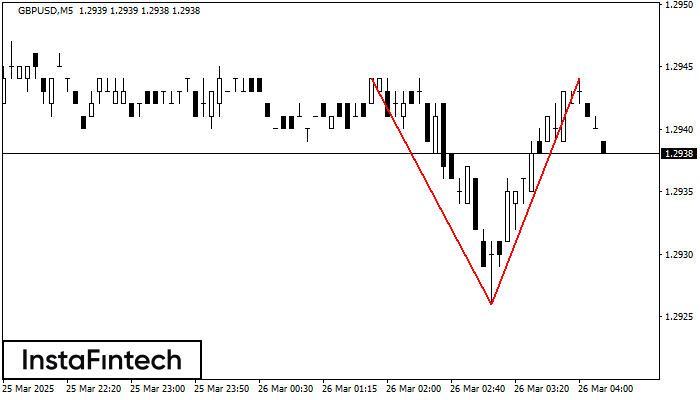
По торговому инструменту GBPUSD на M5 сформировалась фигура «Двойная вершина», которая сигнализирует нам об изменении тенденции с восходящей на нисходящую. Вероятно, что, в случае пробоя основания фигуры 1.2926, возможно дальнейшее нисходящее движение.
Таймфреймы М5 и М15 могут иметь больше ложных точек входа.
Смотрите также
- Все
- Все
- Bearish Rectangle
- Bearish Symmetrical Triangle
- Bearish Symmetrical Triangle
- Bullish Rectangle
- Double Top
- Double Top
- Triple Bottom
- Triple Bottom
- Triple Top
- Triple Top
- Все
- Все
- Покупка
- Продажа
- Все
- 1
- 2
- 3
- 4
- 5
Перевернутая голова и плечи
сформирован 17.05 в 05:40:01 (UTC+0)
сила сигнала 1 из 5

По #Bitcoin на M5 сформировалась фигура «Перевернутая голова и плечи». Голова закреплена на 102549.85, при этом средняя линия шеи расположена на 103359.60/103319.80. Формирование фигуры «Перевернутая голова и плечи» наиболее вероятным
Таймфреймы М5 и М15 могут иметь больше ложных точек входа.
Открыть график инструмента в новом окне
Двойное дно
сформирован 17.05 в 02:15:26 (UTC+0)
сила сигнала 1 из 5

Сформирована фигура «Двойное дно» на графике #Bitcoin M5. Верхняя граница 103642.04; Нижняя граница 103357.83; Ширина фигуры 27887 пунктов. В случае пробоя верхней границы 103642.04 можно будет прогнозировать изменение тенденции
Таймфреймы М5 и М15 могут иметь больше ложных точек входа.
Открыть график инструмента в новом окне
Двойное дно
сформирован 16.05 в 23:45:21 (UTC+0)
сила сигнала 1 из 5

Сформирована фигура «Двойное дно» на графике #Bitcoin M5. Характеристика: Уровень поддержки 103472.45; Уровень сопротивления 103745.49; Ширина фигуры 27304 пунктов. В случае пробоя уровня сопротивления можно будет прогнозировать изменение тенденции
Таймфреймы М5 и М15 могут иметь больше ложных точек входа.
Открыть график инструмента в новом окне