Актуальные паттерны

Паттерны – это графические модели, которые "рисует" цена на графике. Один из постулатов технического анализа говорит нам о том, что история (движение цены) всегда повторяется. Это значит, что в похожих ситуациях движение цены, зачастую, будет похожим, что позволяет с высокой долей вероятности спрогнозировать дальнейшее развитие ситуации.
Актуальные паттерны от ИнстаФорекс – это удобный сервис, который позволит вам всегда быть в курсе последних изменений на рынке и вовремя реагировать на появившиеся подсказки от рынка. В нашем сервисе вы всегда найдете самые свежие и актуальные паттерны на любой паре и на любом таймфрейме.
Медвежий симметричный треугольник
сформирован 25.03 в 21:36:34 (UTC+0)
сила сигнала 2 из 5
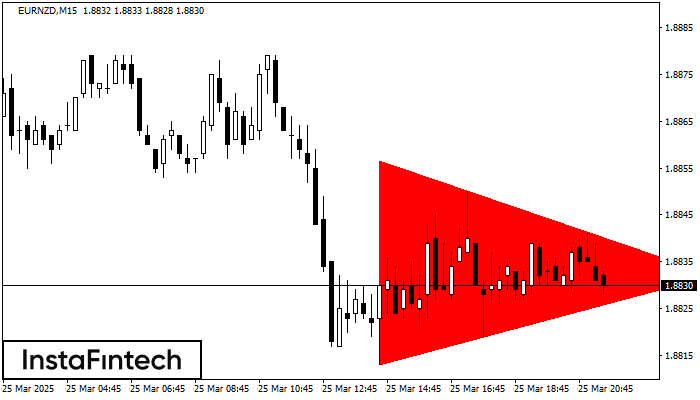
На графике EURNZD на M15 сформировалась фигура «Медвежий симметричный треугольник». Торговые рекомендации: Пробой нижней границы 1.8813 с большой долей вероятности приведет к продолжению нисходящего тренда.
Таймфреймы М5 и М15 могут иметь больше ложных точек входа.
- Все
- Все
- Bearish Rectangle
- Bearish Symmetrical Triangle
- Bearish Symmetrical Triangle
- Bullish Rectangle
- Double Top
- Double Top
- Triple Bottom
- Triple Bottom
- Triple Top
- Triple Top
- Все
- Все
- Покупка
- Продажа
- Все
- 1
- 2
- 3
- 4
- 5
Bullish Symmetrical Triangle
was formed on 22.05 at 08:01:53 (UTC+0)
signal strength 3 of 5

According to the chart of M30, EURUSD formed the Bullish Symmetrical Triangle pattern, which signals the trend will continue. Description. The upper border of the pattern touches the coordinates 1.1362/1.1333
Open chart in a new window
Bearish pennant
was formed on 22.05 at 08:00:35 (UTC+0)
signal strength 4 of 5

The Bearish pennant pattern has formed on the NZDCAD H1 chart. The pattern signals continuation of the downtrend in case the pennant’s low of 0.8197 is broken through. Recommendations: Place
Open chart in a new window
Triple Bottom
was formed on 22.05 at 07:26:02 (UTC+0)
signal strength 1 of 5
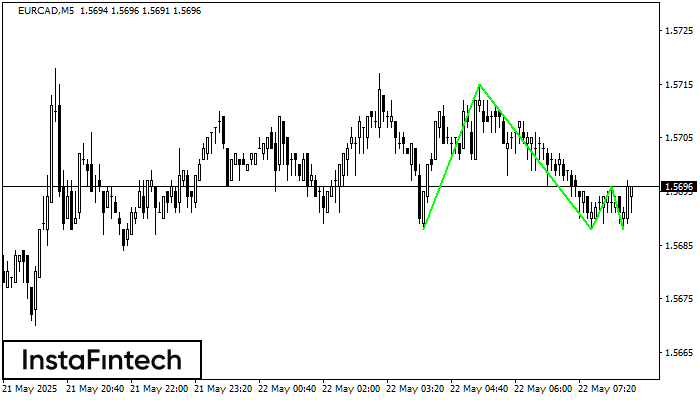
The Triple Bottom pattern has formed on the chart of EURCAD M5. Features of the pattern: The lower line of the pattern has coordinates 1.5715 with the upper limit 1.5715/1.5696
The M5 and M15 time frames may have more false entry points.
Open chart in a new window