

Actual patterns

Patterns are graphical models which are formed in the chart by the price. According to one of the technical analysis postulates, history (price movement) repeats itself. It means that the price movements are often similar in the same situations which makes it possible to predict the further development of the situation with a high probability.
Relevant patterns by InstaTrade is an easy-to-use service which allows you to be aware of latest changes in the market and react to clues from the market in time. In our service you will always find the latest and most relevant patterns on any pair and any timeframe.
Bearish Symmetrical Triangle
was formed on 06.04 at 09:00:08 (UTC+0)
signal strength 4 of 5

According to the chart of H1, #Bitcoin formed the Bearish Symmetrical Triangle pattern. Description: The lower border is 81178.46/83101.84 and upper border is 85102.23/83101.84. The pattern width is measured on the chart at -392377 pips. The formation of the Bearish Symmetrical Triangle pattern evidently signals a continuation of the downward trend. In other words, if the scenario comes true and #Bitcoin breaches the lower border, the price could continue its move toward 83101.44.
- All
- All
- Bearish Rectangle
- Bearish Symmetrical Triangle
- Bearish Symmetrical Triangle
- Bullish Rectangle
- Double Top
- Double Top
- Triple Bottom
- Triple Bottom
- Triple Top
- Triple Top
- All
- All
- Buy
- Sale
- All
- 1
- 2
- 3
- 4
- 5
Doble Techo
was formed on 17.04 at 19:47:53 (UTC+0)
signal strength 2 of 5
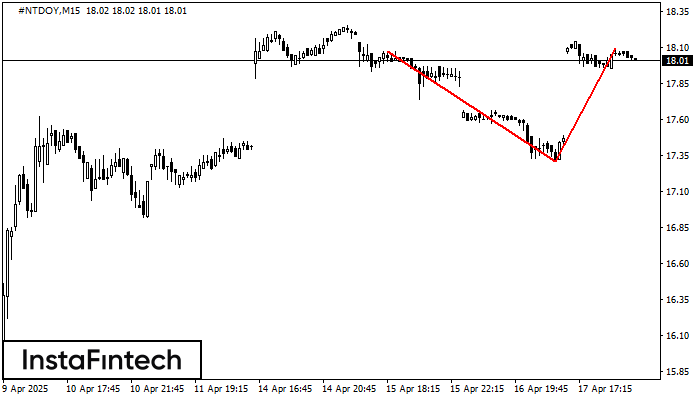
El patrón de reversión Doble Techo ha sido formado en #NTDOY M15. Características: el límite superior 18.07; el límite inferior 17.31; el ancho del patrón es 78 puntos. Es mejor
Los marcos de tiempo M5 y M15 pueden tener más puntos de entrada falsos.
Open chart in a new window
Banderín alcista
was formed on 17.04 at 19:46:18 (UTC+0)
signal strength 2 of 5

El patrón Banderín alcista está formado en el gráfico AUDJPY M15. Este es un tipo de patrón de continuación. Supuestamente, en caso de que el precio se fije por encima
Los marcos de tiempo M5 y M15 pueden tener más puntos de entrada falsos.
Open chart in a new window
Triángulo Simétrico Alcista
was formed on 17.04 at 19:29:20 (UTC+0)
signal strength 1 of 5
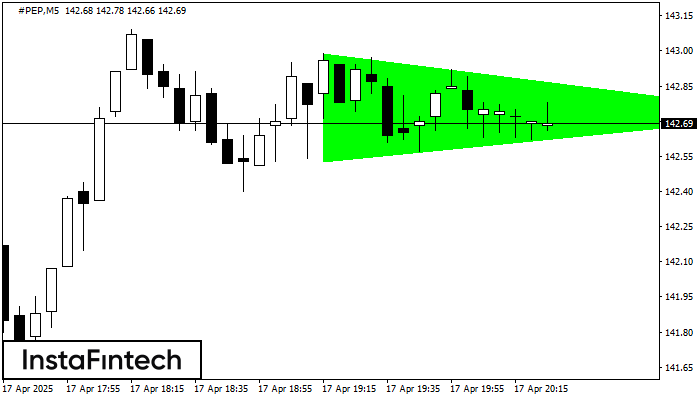
Según el gráfico de M5, #PEP formó el patrón Triángulo Simétrico Alcista. Descripción: Este es el patrón de la continuación de una tendencia. 142.99 y 142.53 son las coordenadas
Los marcos de tiempo M5 y M15 pueden tener más puntos de entrada falsos.
Open chart in a new window


