

Actual patterns

Patterns are graphical models which are formed in the chart by the price. According to one of the technical analysis postulates, history (price movement) repeats itself. It means that the price movements are often similar in the same situations which makes it possible to predict the further development of the situation with a high probability.
Relevant patterns by InstaTrade is an easy-to-use service which allows you to be aware of latest changes in the market and react to clues from the market in time. In our service you will always find the latest and most relevant patterns on any pair and any timeframe.
Double Bottom
was formed on 04.04 at 03:00:34 (UTC+0)
signal strength 4 of 5
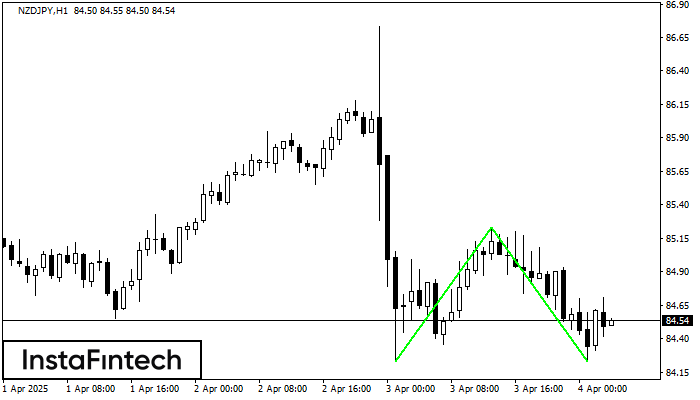
The Double Bottom pattern has been formed on NZDJPY H1; the upper boundary is 85.23; the lower boundary is 84.23. The width of the pattern is 100 points. In case of a break of the upper boundary 85.23, a change in the trend can be predicted where the width of the pattern will coincide with the distance to a possible take profit level.
- All
- All
- Bearish Rectangle
- Bearish Symmetrical Triangle
- Bearish Symmetrical Triangle
- Bullish Rectangle
- Double Top
- Double Top
- Triple Bottom
- Triple Bottom
- Triple Top
- Triple Top
- All
- All
- Buy
- Sale
- All
- 1
- 2
- 3
- 4
- 5
Doble Techo
was formed on 02.05 at 08:40:32 (UTC+0)
signal strength 1 of 5
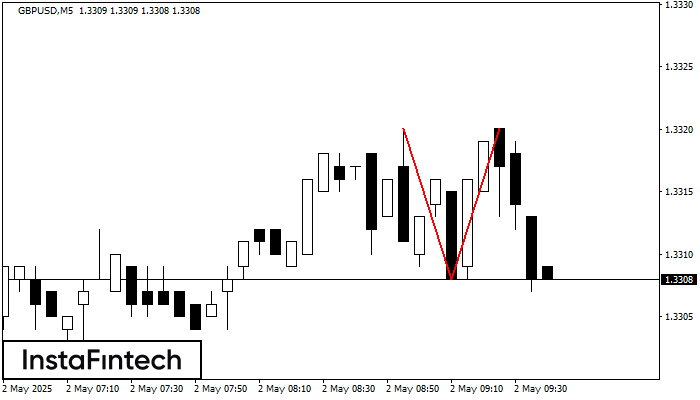
El patrón de reversión Doble Techo ha sido formado en GBPUSD M5. Características: el límite superior 1.3320; el límite inferior 1.3308; el ancho del patrón es 12 puntos. Es mejor
Los marcos de tiempo M5 y M15 pueden tener más puntos de entrada falsos.
Open chart in a new window
Rectángulo Alcista
was formed on 02.05 at 08:30:15 (UTC+0)
signal strength 3 of 5
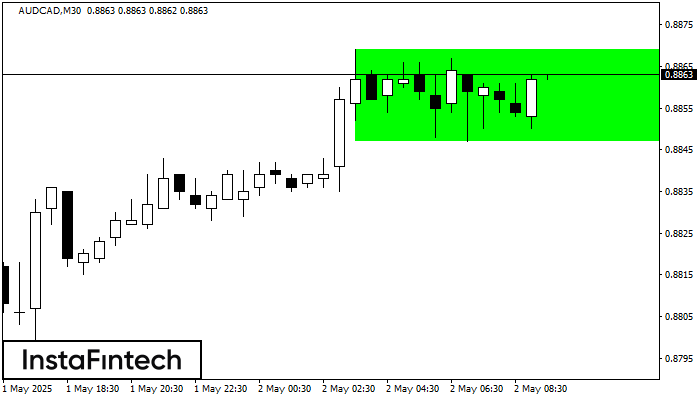
Según el gráfico de M30, AUDCAD formó el Rectángulo Alcista. El patrón indica la continuación de una tendencia. El límite superior es 0.8869, el límite inferior es 0.8847. La señal
Open chart in a new window
Rectángulo Alcista
was formed on 02.05 at 08:20:59 (UTC+0)
signal strength 2 of 5
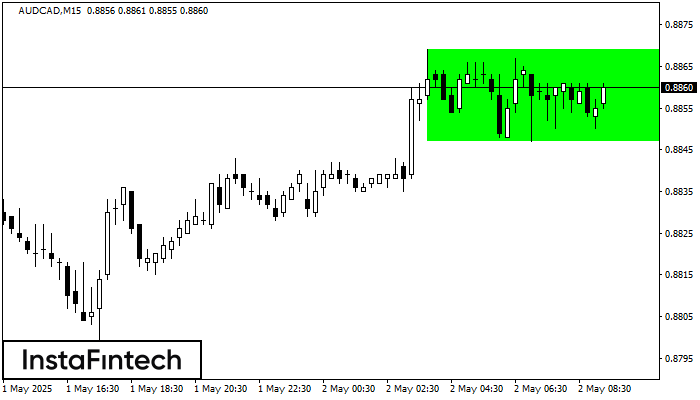
Según el gráfico de M15, AUDCAD formó el Rectángulo Alcista. Este tipo de patrón indica la continuación de una tendencia. Esto consiste de dos niveles: resistencia 0.8869 y soporte 0.8847
Los marcos de tiempo M5 y M15 pueden tener más puntos de entrada falsos.
Open chart in a new window


