

Actual patterns

Patterns are graphical models which are formed in the chart by the price. According to one of the technical analysis postulates, history (price movement) repeats itself. It means that the price movements are often similar in the same situations which makes it possible to predict the further development of the situation with a high probability.
Relevant patterns by InstaTrade is an easy-to-use service which allows you to be aware of latest changes in the market and react to clues from the market in time. In our service you will always find the latest and most relevant patterns on any pair and any timeframe.
Actual Patterns
- All
- All
- Bearish Rectangle
- Bearish Symmetrical Triangle
- Bearish Symmetrical Triangle
- Bullish Rectangle
- Double Top
- Double Top
- Triple Bottom
- Triple Bottom
- Triple Top
- Triple Top
- All
- All
- Buy
- Sale
- All
- 1
- 2
- 3
- 4
- 5
Double Top
was formed on 01.05 at 02:45:07 (UTC+0)
signal strength 2 of 5
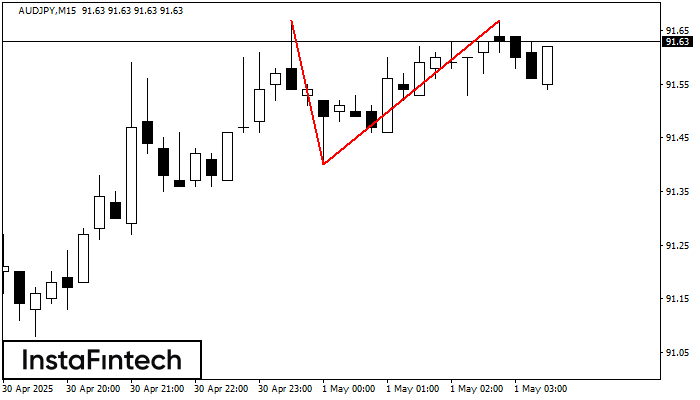
The Double Top reversal pattern has been formed on AUDJPY M15. Characteristics: the upper boundary 91.67; the lower boundary 91.40; the width of the pattern is 27 points. Sell trades
The M5 and M15 time frames may have more false entry points.
Open chart in a new window
Double Bottom
was formed on 01.05 at 02:30:22 (UTC+0)
signal strength 1 of 5
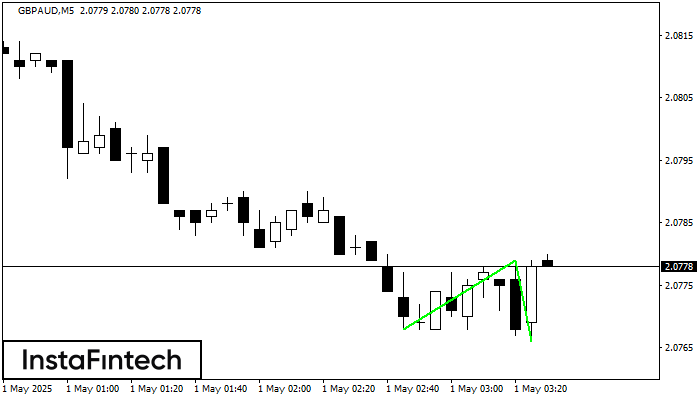
The Double Bottom pattern has been formed on GBPAUD M5. This formation signals a reversal of the trend from downwards to upwards. The signal is that a buy trade should
The M5 and M15 time frames may have more false entry points.
Open chart in a new window
Bullish Symmetrical Triangle
was formed on 01.05 at 01:51:59 (UTC+0)
signal strength 1 of 5
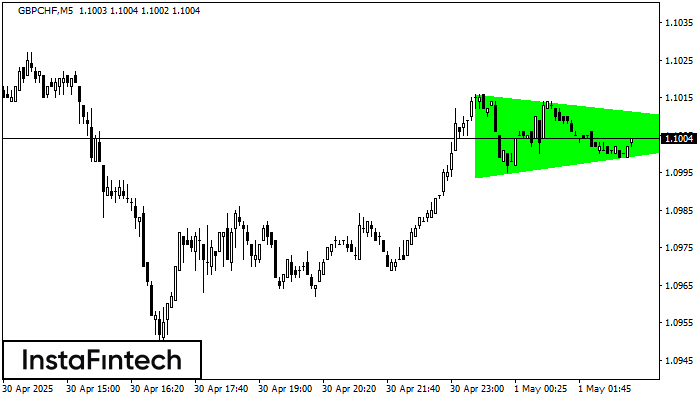
According to the chart of M5, GBPCHF formed the Bullish Symmetrical Triangle pattern. Description: This is the pattern of a trend continuation. 1.1016 and 1.0994 are the coordinates
The M5 and M15 time frames may have more false entry points.
Open chart in a new window
Bullish Symmetrical Triangle
was formed on 01.05 at 01:49:10 (UTC+0)
signal strength 2 of 5
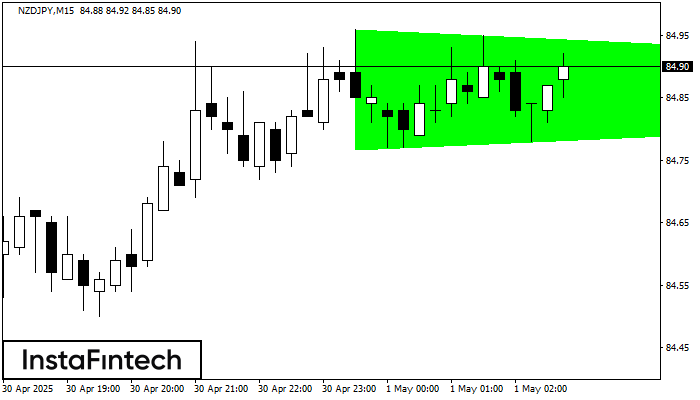
According to the chart of M15, NZDJPY formed the Bullish Symmetrical Triangle pattern. Description: This is the pattern of a trend continuation. 84.96 and 84.77 are the coordinates
The M5 and M15 time frames may have more false entry points.
Open chart in a new window
Bullish Rectangle
was formed on 01.05 at 01:49:04 (UTC+0)
signal strength 2 of 5
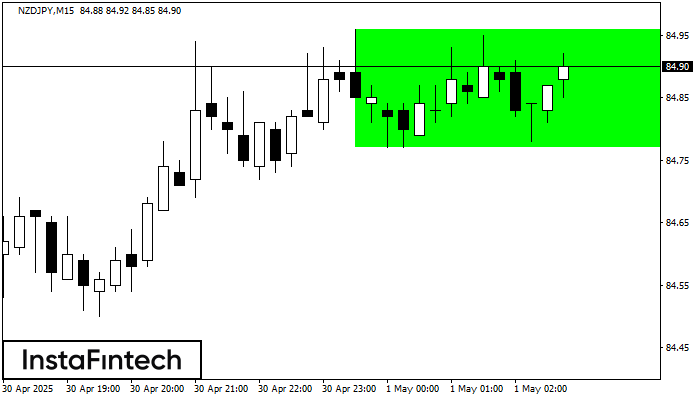
According to the chart of M15, NZDJPY formed the Bullish Rectangle which is a pattern of a trend continuation. The pattern is contained within the following borders: the lower border
The M5 and M15 time frames may have more false entry points.
Open chart in a new window
Bullish Symmetrical Triangle
was formed on 01.05 at 01:34:53 (UTC+0)
signal strength 1 of 5
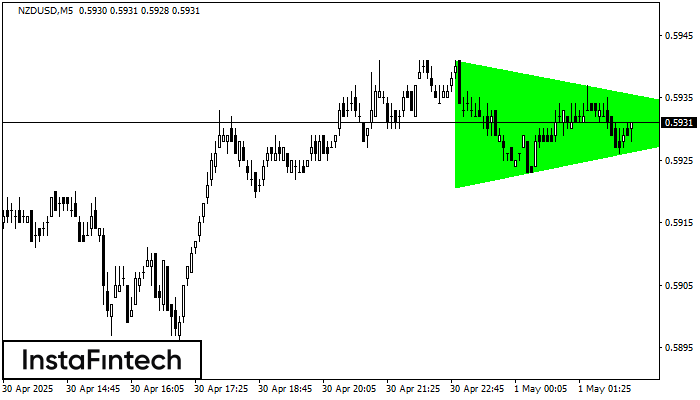
According to the chart of M5, NZDUSD formed the Bullish Symmetrical Triangle pattern. The lower border of the pattern touches the coordinates 0.5921/0.5931 whereas the upper border goes across 0.5941/0.5931
The M5 and M15 time frames may have more false entry points.
Open chart in a new window
Bearish Symmetrical Triangle
was formed on 01.05 at 01:16:49 (UTC+0)
signal strength 2 of 5
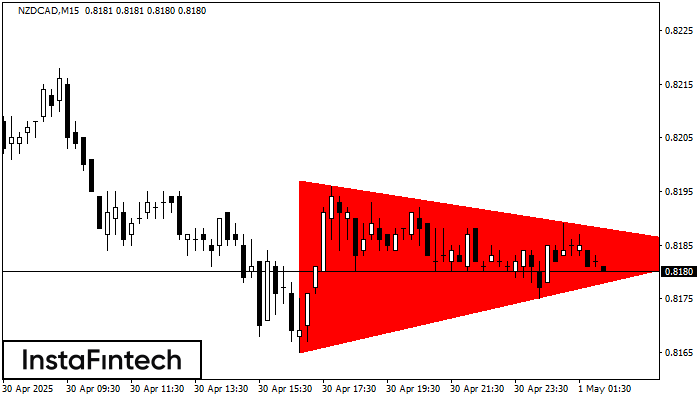
According to the chart of M15, NZDCAD formed the Bearish Symmetrical Triangle pattern. Description: The lower border is 0.8165/0.8184 and upper border is 0.8197/0.8184. The pattern width is measured
The M5 and M15 time frames may have more false entry points.
Open chart in a new window
Double Top
was formed on 01.05 at 01:15:25 (UTC+0)
signal strength 2 of 5
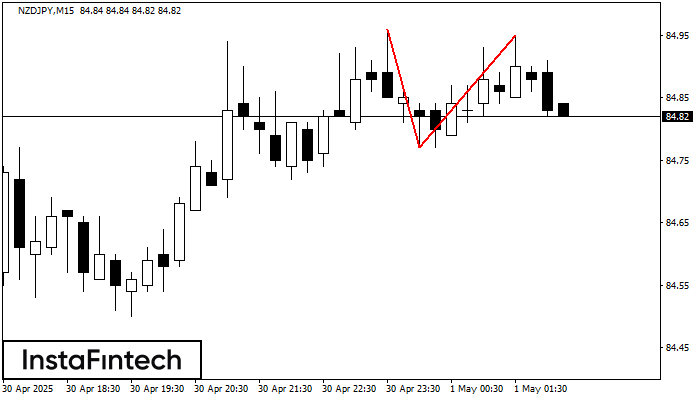
On the chart of NZDJPY M15 the Double Top reversal pattern has been formed. Characteristics: the upper boundary 84.95; the lower boundary 84.77; the width of the pattern 18 points
The M5 and M15 time frames may have more false entry points.
Open chart in a new window
Double Top
was formed on 01.05 at 01:15:22 (UTC+0)
signal strength 2 of 5
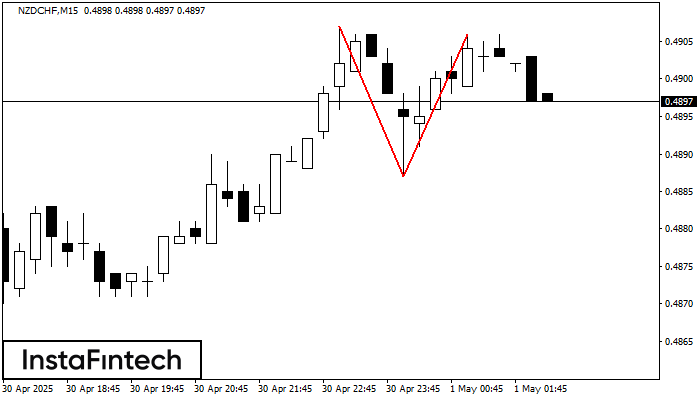
The Double Top reversal pattern has been formed on NZDCHF M15. Characteristics: the upper boundary 0.4907; the lower boundary 0.4887; the width of the pattern is 19 points. Sell trades
The M5 and M15 time frames may have more false entry points.
Open chart in a new window


